
Ebizq.net, By Nari Kannan on January 12, 2010
Geotime is a cool technology from research and now into products from a company called Oculus. It allows you to combine the three major ingredients of most Business Intelligence data collection and analysis - Data, Time and Geography!
Here's an excellent video of what you can do with these three ingredients and how you can get the bigger picture and also how, when it moved, where!
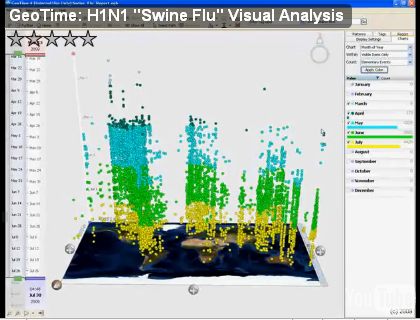
This is a demo of how Geotime is used to analyze the spread of the H1N1 (Swine Flu) Virus around the globe. What is striking is also analyzing the spread of the disease by correlating it with Flight Data that carried infected passengers!
Read full story
(Editor: The snapshot below shows the number of cases in columns above geographic locations; color coded for different periods.)
 .
.