
dsparks.wordpress.com, David Sparks, July 18, 2012
At the upcoming 2012 summer meeting of the Society of Political Methodology, I will be presenting a poster on Isarithmic Maps of Public Opinion. Since last posting on the topic, I have made major improvements to the code and robustness of the modeling approach, and written a tutorial that illustrates the production of such maps.
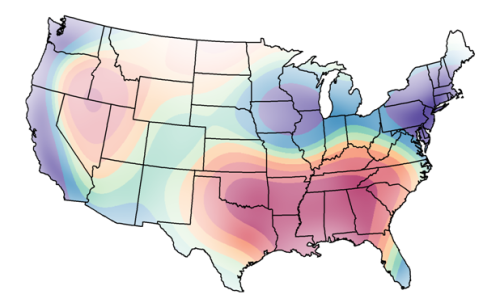
(Gregory PS: Isarithmic maps, also known as contour maps or isopleth maps depict smooth continuous phenomena such as precipitation or elevation.)
This tutorial, in a very rough draft form, can be downloaded here [PDF].
Isarithmic Maps of Public Opinion
Abstract
Many social scientists are familiar with the use and interpretation of choropleth maps for the display of geospatially-distributed data. However, political
boundaries are not always the best delineation along which the display variable of interest can be partitioned. This vignette introduces and justifies an
isarithmic approach to the display of public opinion data, offering several helper
functions and working through the process of transforming survey responses to
a graphical display of their spatial distribution.
Read more.