R and Hadoop make Machine Learning Possible for Everyone
R and Hadoop make machine learning approachable enough for inexperienced users to begin analyzing and visualizing interesting data to start down the path in this lucrative field.
By Joel Horwitz (H2O.ai), Nov 2014.
In statistics, bootstrapping can refer to any test or metric that relies on random sampling with replacement. In simple terms, it allows a way to measure the accuracy of the sampling distribution often used in constructing a hypothesis test. In business, bootstrapping refers to starting a business without external help or capital. Bootstrapping in general parlance refers to an absurdly impossible action, “to pull oneself over a fence by one’s bootstraps.” R and Hadoop are very much bootstrapped technologies having received zero direct investment capital and relying on what might appear to be a random group of contributors over the past 20 years in practically every industry and use case imaginable.
R Pirates Pillage Businesses Worldwide
R first appeared in 1993 when Ross Ihaka and Robert Gentleman at the University of Auckland released a free version as a software package. Since then, R has grown to over 3 million users in the US alone according to the download site log files released last year.
In addition, R surpassed SAS with over 7,000 unique packages you can view on Crantastic website. It is no wonder it has found wide use in many industries and academia. In fact, during the summer of 2014, R surpassed IBM SPSS as the most widely used analytics software for scholarly articles according to Robert Muenchen. For this reason, R is now the “Gold Standard” for doing all sorts of statistics, economics, and even machine learning. Furthermore, from my experience I found that many if not most people use R as a complimentary tool today for spot checking their work even when using other far more expensive or popular enterprise software. It is no wonder R is quickly taking over as the go to tool for Data Scientists in the 21st century.
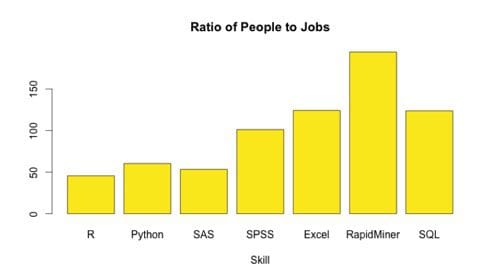
What is fueling R growth is predominantly the community for making the core software useful and relevant by providing answers to common questions via many blogs and user groups. In addition, it is clear there is an underserved job market according to data from LinkedIn (see image below). Due to this demand, R is now offered in practically all major universities as the de facto language for statistical programming and many new online courses are starting each day. Datacamp is one such example having built an interactive web environment with rich lessons that non-programmers can easily get started without ever touching a command line.
 Businesses too are flocking to statistics and embracing the probabilistic vs the deterministic nature of problems that arise when data is expanding at an increasing size and rate where tradition Business Intelligence cannot keep pace. For this reason, many turned to Hadoop to open up the data platform to unlock the world of enterprise data management that had been kept away from business analysts for many years. Gone are the days of pre-filtered, pre-aggregated dashboards and excel workbooks that are emailed around haphazardly to executives and decision makers left to little interpretation or devoid of any “storytelling” to guide the business to make informed decisions.
Hadoop Growth
Apache Hadoop came almost 10 years after R first hit the scene in 2005 and wasn’t widely adopted until as late as 2013 when more than half of the Fortune 50 got around to building their own clusters. The name “Hadoop” is after a toy elephant of famed Yahoo! engineer Doug Cutting who along with Mike Cafarella originally developed the technology to create a better search engine, of course. Along with its ability to process enormous sums of data on relatively inexpensive hardware, it also made it possible to store data on a distributed file system (HDFS) without having to transform it ahead of time. As with R, many open source projects were created to re-imagine the data platform. Starting with getting data into HDFS (sqoop, flume, kafka, etc.) to compute and streaming (Spark, YARN, MapReduce, Storm, etc.), to querying data (Hive, Pig, Stinger / Tez, Drill, Presto, etc.), to datastores (Hbase, Cassandra, Redis, Voldermort, etc.), to schedulers (Oozie, Cascading, Scalding, etc.), and finally to Machine Learning (Mahout, MLlib, H2O, etc.) among many other applications.
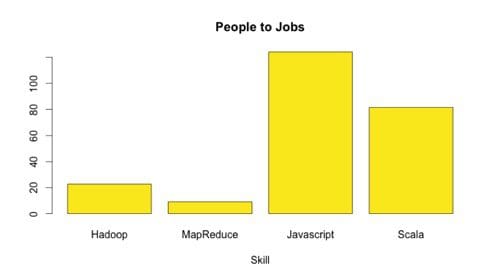
Unfortunately, there is not a simple way to see all of these technologies and easily install with one line of code like R. Nor is MapReduce a simple language for the average developer. In fact, you can clearly see the shortage like R of Hadoop and MapReduce skilled workers to the number of jobs available thanks to LinkedIn. It is for this reason Hadoop has not fully caught fire in the same way R has and there is talk of its demise at the recent Strata Hadoop World conference in NYC this past fall.
What’s the Real Problem Here? In One Answer, Data
Over the past few years, the issues of data have cropped up in the field of data science as the number one problem faced when working with the vast variety and volumes of data. I’d be remiss to not mention the velocity of unrelenting data waves crashing against our fragile analysis environments. In fact, it is projected that the volume of data is expected to exceed the number of stars in the universe by 2020 according to IDC. Fortunately, there is an entirely new approach to this problem that has until now escaped us in our persistent habit of wanting to constrain data to our querying tools.
Machine Learning is the new SQL
Put simply, “Machine Learning is a scientific discipline that deals with the construction and study of algorithms that can learn from data.” It is a quantum shift in the standard way of simply counting things; instead, its the start of a fantastic journey into the deeper pools of the unknown.

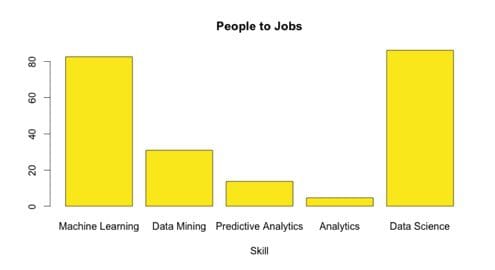
So here comes the really interesting part of the story. According to my LinkedIn analysis, Machine Learning and Data Science are actually very well matched to the overall demand in the job market to the people available (unlike R and Hadoop).
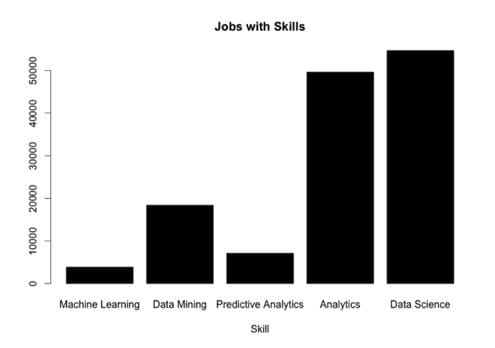
We’ll need another plot to really understand what is going on here of the actual number of jobs that exist for Data Science vs Machine Learning. My interpretation of this graph is that the job of a data scientist today is synonymous to that of an analytics professional or analyst and the real opportunity is in the growing area of Machine Learning.
 Machine Learning is the New Kid on the Block
Data Science was first described as the intersection of programming or “hacking skills”, math and statistics along with business expertise according to Drew Conway’s blog. As it turns out, programming is too generic a term and what is really meant is applied math to large scale data through new algorithms that can crawl through this tangled mess. To search for answers in this jungle, simply flying over the canopy will not reveal the treasure boxes hidden just beneath the canopy. It is evident to me from the number of machine learning projects that have cropped up and the maturity of the market accepting probabilistic information not only deterministic marks a new era in the race to find value in our data assets.
Hadoop 2.0 is Here, Sort Of
Many people have tried to claim that Hadoop 2.0 had arrived with MR2 or YARN or high-availability HDFS capabilities, but this is a misnomer when considering the similarly named Web 2.0 that brought us into the age of the web applications like Facebook, Twitter, LinkedIn, Amazon, and the vast majority of the internet. According to John Battelle and Tim O’Reilly of now Strata fame defined the shift as simply “Web as a Platform” meaning software applications are built upon the Web as opposed to the desktop. Hints of this change is coming from Apache Spark making it easier to develop applications on Hadoop and H2O making it finally possible for R and Hadoop to work together. It is clear to me having worked in the “Big Data” industry for some time, software developers and statisticians want to program in their language, not MapReduce. It's an exciting time to move off the desktop and onto the cluster where the constraints are lifted and the opportunities are endless.
As an open source project like R and Apache Hadoop, H2O must not only demonstrate continuing value to the community, but also stand up to the most stringent industry use cases imaginable. Having started in 2012, H2O focused first on creating the community through over 120 meet-ups to grow the user base to over 7000 strong. H2O is a bridge for R users to move beyond their laptop and onto a large scale environment to train data that doesn’t fit inside the memory of their laptop. It is a fundamental shift in how we approach the data problem and is producing reliable results for numerous production customers ranging from retail to insurance to health to high tech. To learn more about how you can get started go to http://www.h2o.ai to get started for free.
Jobs and Skills Analysis Explained
Many people have conducted research as of late on the growing popularity of statistical software using indirect methods like academic research citations, job posts, books, website traffic, blogs, surveys like KDnuggets annual poll, GitHub Activity and many more. However, all of these methods have generally been focused on the technical crowd. Where the rubber meets the road is in the business context which in my mind LinkedIn represents as it is highly representative of the business world. Further, if you want to go to an even more general audience you can perform the same trick with Google Adwords. Reverse engineering Ad platforms is a good way to get back of the envelope market sizing information. I wrote a complete blog on this subject on my personal blog. In the following instructions, I’ll walk through how I used LinkedIn as my sample and R to analyze the business market for my analysis above.
1. Data Gathering
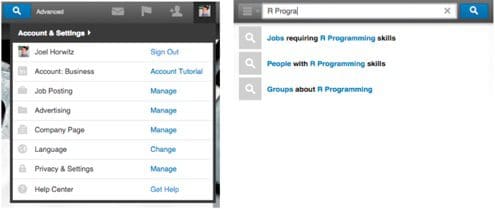
There are two ways to gather data from LinkedIn. One is to use the ad shown in the left image below or the other is to use the direct search functionality shown to the right below.

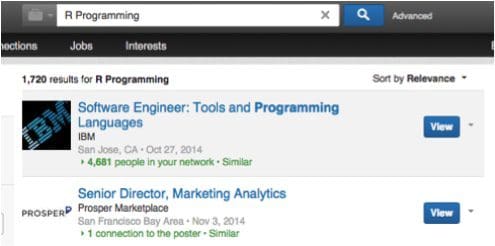
In this case, I went the manual route and used the search function. For each product category that I search there is a count of results that show up and use that as a proxy for demand. See below:

From this example, we can see the phrase “R Programming” has 1720 results. I’ve also included “R statistics” and other “R” relevant terms.
2. Data Analysis
As a new R user myself, I manually created each data frame to hold the data by first creating the individual vectors for the people and jobs:
after I created a simple data frame:
to get the ratio, I simply use the transform function:
3. Data Visualization
R comes with many visualization packages, the most notable one being ggplot2. For this situation, I used a built in barplot as it was much easier out of the box. Frankly, the visualizations that are produced in R may not seem the most compelling to the general audience, but it does force you to consider what you’re plotting making for more informed visuals.
to get the bar graph (in H2O colors):
Thats it! Pretty simple and I am sure there are ways of doing this analysis more elegantly, but for me this was the way that I can be sure the analysis makes sense.
To get the full script you can download to try yourself or add to my analysis.
Related:
In statistics, bootstrapping can refer to any test or metric that relies on random sampling with replacement. In simple terms, it allows a way to measure the accuracy of the sampling distribution often used in constructing a hypothesis test. In business, bootstrapping refers to starting a business without external help or capital. Bootstrapping in general parlance refers to an absurdly impossible action, “to pull oneself over a fence by one’s bootstraps.” R and Hadoop are very much bootstrapped technologies having received zero direct investment capital and relying on what might appear to be a random group of contributors over the past 20 years in practically every industry and use case imaginable.
R Pirates Pillage Businesses Worldwide
R first appeared in 1993 when Ross Ihaka and Robert Gentleman at the University of Auckland released a free version as a software package. Since then, R has grown to over 3 million users in the US alone according to the download site log files released last year.
In addition, R surpassed SAS with over 7,000 unique packages you can view on Crantastic website. It is no wonder it has found wide use in many industries and academia. In fact, during the summer of 2014, R surpassed IBM SPSS as the most widely used analytics software for scholarly articles according to Robert Muenchen. For this reason, R is now the “Gold Standard” for doing all sorts of statistics, economics, and even machine learning. Furthermore, from my experience I found that many if not most people use R as a complimentary tool today for spot checking their work even when using other far more expensive or popular enterprise software. It is no wonder R is quickly taking over as the go to tool for Data Scientists in the 21st century.
What is fueling R growth is predominantly the community for making the core software useful and relevant by providing answers to common questions via many blogs and user groups. In addition, it is clear there is an underserved job market according to data from LinkedIn (see image below). Due to this demand, R is now offered in practically all major universities as the de facto language for statistical programming and many new online courses are starting each day. Datacamp is one such example having built an interactive web environment with rich lessons that non-programmers can easily get started without ever touching a command line.
 Businesses too are flocking to statistics and embracing the probabilistic vs the deterministic nature of problems that arise when data is expanding at an increasing size and rate where tradition Business Intelligence cannot keep pace. For this reason, many turned to Hadoop to open up the data platform to unlock the world of enterprise data management that had been kept away from business analysts for many years. Gone are the days of pre-filtered, pre-aggregated dashboards and excel workbooks that are emailed around haphazardly to executives and decision makers left to little interpretation or devoid of any “storytelling” to guide the business to make informed decisions.
Hadoop Growth
Apache Hadoop came almost 10 years after R first hit the scene in 2005 and wasn’t widely adopted until as late as 2013 when more than half of the Fortune 50 got around to building their own clusters. The name “Hadoop” is after a toy elephant of famed Yahoo! engineer Doug Cutting who along with Mike Cafarella originally developed the technology to create a better search engine, of course. Along with its ability to process enormous sums of data on relatively inexpensive hardware, it also made it possible to store data on a distributed file system (HDFS) without having to transform it ahead of time. As with R, many open source projects were created to re-imagine the data platform. Starting with getting data into HDFS (sqoop, flume, kafka, etc.) to compute and streaming (Spark, YARN, MapReduce, Storm, etc.), to querying data (Hive, Pig, Stinger / Tez, Drill, Presto, etc.), to datastores (Hbase, Cassandra, Redis, Voldermort, etc.), to schedulers (Oozie, Cascading, Scalding, etc.), and finally to Machine Learning (Mahout, MLlib, H2O, etc.) among many other applications.
Unfortunately, there is not a simple way to see all of these technologies and easily install with one line of code like R. Nor is MapReduce a simple language for the average developer. In fact, you can clearly see the shortage like R of Hadoop and MapReduce skilled workers to the number of jobs available thanks to LinkedIn. It is for this reason Hadoop has not fully caught fire in the same way R has and there is talk of its demise at the recent Strata Hadoop World conference in NYC this past fall.
What’s the Real Problem Here? In One Answer, Data
Over the past few years, the issues of data have cropped up in the field of data science as the number one problem faced when working with the vast variety and volumes of data. I’d be remiss to not mention the velocity of unrelenting data waves crashing against our fragile analysis environments. In fact, it is projected that the volume of data is expected to exceed the number of stars in the universe by 2020 according to IDC. Fortunately, there is an entirely new approach to this problem that has until now escaped us in our persistent habit of wanting to constrain data to our querying tools.
Machine Learning is the new SQL
Put simply, “Machine Learning is a scientific discipline that deals with the construction and study of algorithms that can learn from data.” It is a quantum shift in the standard way of simply counting things; instead, its the start of a fantastic journey into the deeper pools of the unknown.
So here comes the really interesting part of the story. According to my LinkedIn analysis, Machine Learning and Data Science are actually very well matched to the overall demand in the job market to the people available (unlike R and Hadoop).
We’ll need another plot to really understand what is going on here of the actual number of jobs that exist for Data Science vs Machine Learning. My interpretation of this graph is that the job of a data scientist today is synonymous to that of an analytics professional or analyst and the real opportunity is in the growing area of Machine Learning.
 Machine Learning is the New Kid on the Block
Data Science was first described as the intersection of programming or “hacking skills”, math and statistics along with business expertise according to Drew Conway’s blog. As it turns out, programming is too generic a term and what is really meant is applied math to large scale data through new algorithms that can crawl through this tangled mess. To search for answers in this jungle, simply flying over the canopy will not reveal the treasure boxes hidden just beneath the canopy. It is evident to me from the number of machine learning projects that have cropped up and the maturity of the market accepting probabilistic information not only deterministic marks a new era in the race to find value in our data assets.
"The machine does not isolate man from the great problems of nature but plunges him more deeply into them.” - Antoine de St. Exupery
Hadoop 2.0 is Here, Sort Of
Many people have tried to claim that Hadoop 2.0 had arrived with MR2 or YARN or high-availability HDFS capabilities, but this is a misnomer when considering the similarly named Web 2.0 that brought us into the age of the web applications like Facebook, Twitter, LinkedIn, Amazon, and the vast majority of the internet. According to John Battelle and Tim O’Reilly of now Strata fame defined the shift as simply “Web as a Platform” meaning software applications are built upon the Web as opposed to the desktop. Hints of this change is coming from Apache Spark making it easier to develop applications on Hadoop and H2O making it finally possible for R and Hadoop to work together. It is clear to me having worked in the “Big Data” industry for some time, software developers and statisticians want to program in their language, not MapReduce. It's an exciting time to move off the desktop and onto the cluster where the constraints are lifted and the opportunities are endless.
As an open source project like R and Apache Hadoop, H2O must not only demonstrate continuing value to the community, but also stand up to the most stringent industry use cases imaginable. Having started in 2012, H2O focused first on creating the community through over 120 meet-ups to grow the user base to over 7000 strong. H2O is a bridge for R users to move beyond their laptop and onto a large scale environment to train data that doesn’t fit inside the memory of their laptop. It is a fundamental shift in how we approach the data problem and is producing reliable results for numerous production customers ranging from retail to insurance to health to high tech. To learn more about how you can get started go to http://www.h2o.ai to get started for free.
Jobs and Skills Analysis Explained
Many people have conducted research as of late on the growing popularity of statistical software using indirect methods like academic research citations, job posts, books, website traffic, blogs, surveys like KDnuggets annual poll, GitHub Activity and many more. However, all of these methods have generally been focused on the technical crowd. Where the rubber meets the road is in the business context which in my mind LinkedIn represents as it is highly representative of the business world. Further, if you want to go to an even more general audience you can perform the same trick with Google Adwords. Reverse engineering Ad platforms is a good way to get back of the envelope market sizing information. I wrote a complete blog on this subject on my personal blog. In the following instructions, I’ll walk through how I used LinkedIn as my sample and R to analyze the business market for my analysis above.
1. Data Gathering
There are two ways to gather data from LinkedIn. One is to use the ad shown in the left image below or the other is to use the direct search functionality shown to the right below.
In this case, I went the manual route and used the search function. For each product category that I search there is a count of results that show up and use that as a proxy for demand. See below:
From this example, we can see the phrase “R Programming” has 1720 results. I’ve also included “R statistics” and other “R” relevant terms.
2. Data Analysis
As a new R user myself, I manually created each data frame to hold the data by first creating the individual vectors for the people and jobs:
name<-c(“R”,”Python”,"SAS","SPSS","Excel","RapidMiner","SQL")

people <- c(230750,815555,128860,752205,15390756,3306,4648240)

jobs <-c(5059,13519,2414,7429,123874,17,37571)
after I created a simple data frame:
skills <- data.frame(c(name),c(people),c(jobs))
to get the ratio, I simply use the transform function:
skills <- transform(skills, ratio=people/job)
3. Data Visualization
R comes with many visualization packages, the most notable one being ggplot2. For this situation, I used a built in barplot as it was much easier out of the box. Frankly, the visualizations that are produced in R may not seem the most compelling to the general audience, but it does force you to consider what you’re plotting making for more informed visuals.
to get the bar graph (in H2O colors):
barplot(skills$ratio,names.arg=name,col=“#fbe920”, main=“Ratio of People to Jobs”,xlab=“Skill”)
Thats it! Pretty simple and I am sure there are ways of doing this analysis more elegantly, but for me this was the way that I can be sure the analysis makes sense.
To get the full script you can download to try yourself or add to my analysis.
Related:
- Data Science Skills and Business Problems
- Data Visualization of Census Data with R
- STRATA + Hadoop World 2014 NYC Report