3D Data Sculptures: a New Way to Visualize Data
3D printing can go beyond printing products like iPod cases, or butterfly earrings, and can offer a sustainable way to understand strategic DATA by printing decision support landscapes.
By Volker Schweisfurth, (MeliesArt).
The physical representation of data has 7000 years of tradition: The Sumerians used pieces of clay to represent units of measure; native Micronesians made physical visualizations that showed ocean swell patterns to facilitate canoe navigation.
Let yourself be influenced by art
With the help of 3D printing the cultural technique to create tangible “data landscapes” may be recharged in our digital age. Remember that art often paves the way for industrial use. Examples: The 3D data sculpture from a seismogram of an earthquake in Japan (by Luke Jerram; Tate Modern, London); Loren Madsen who visualized the US Defense Budget with a carved wood sculpture ; Davide Quaola invented the virtual deconstructions of Michelangelo sculptures and their interpretation on a Voxeljet 3D printer.
Some 3D printed Data Sculptures and their background
The pictures below shows some of MeliesArt “statistics at your fingertips” that give more life to data. Data Sculptures do not use volatile data, but strategic data of studies published by international organizations and business journals. In short: Data that are worth to be remembered and to be circulated.
See these MeliesArt Data Sculptures, all printed in Europe by experienced print shops: 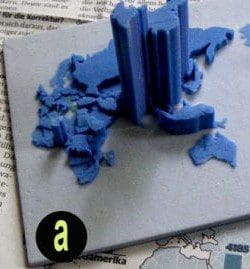
a) People probably will not go rummaging through the internet looking for a World Bank report about population estimations for 2050, They may never realize that the population of China will be quickly passed by India! But when you look at model a) on the illustration, you see the twin towers of India and China- and may remember.
b) A portfolio of the 12 risks which may threaten the survival of humanity ( expected probabilities as heights in exponential form )
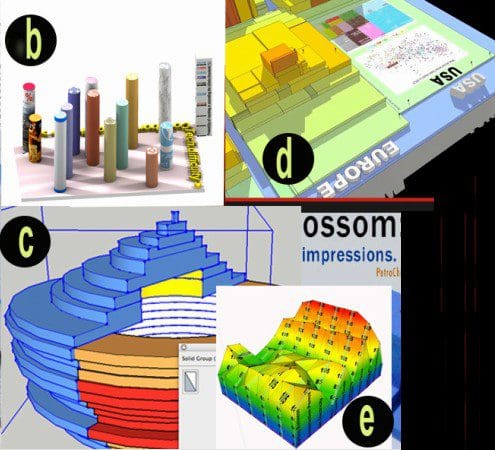
c) CAD- draft of a country population pyramid (for year 2030)
d) Landscape of 160 world economies ( GNIs/ investment hindrances level by country): a tangible model in A4 size; also see below
e) 10 “Doing Business” factors of a major country over time (i.e. its investment landscape); World Bank regularly does the monitoring for 180 countries. But who exploits the stories?
f) Here, an Excel spreadsheet becomes solid: 120 world’s biggest companies by region and country; with market capitalization and turnover (2013).
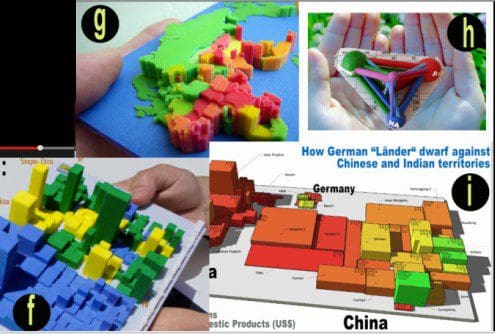
g) World map of investment conditions (heights) /GNI (color); also see d)
h) Intra- and inter-regional trade flow by size ($) (world); data by WTO
i) Comparison of Chinese Provinces, Indian States and German Bundesländer by size, population and income per capita
Some workflow experience
Making CAD models printable (“watertight”) remains labor intensive, but is increasingly supported by print shop tools (Sculpteo, iMaterialize, Shapeways etc).
With suitable axis selection you can build decision support data models. See clip d) or better still its animation (https://www.youtube.com/watch?v=4WOV6eVCP7I) as a “flight over 160 economies”. The xy areas show the Gross National Products (in US$) of 160 economies (= market chances), the heights of country blocks represent their ranking position according to the annual World Bank Study on investment conditions (“Doing Business”): The poorer the rank , the greater the height. Thus, the 3D Designer is able to introduce analogies (e.g. Tour de France, mountain climbing ) , to better illustrate the market expansion efforts in different regions ; supported by the visual- tactile properties of the physical color models .
Four reasons for a growing role of Data Sculptures
For me, there are four main reasons for growing interest in 3D printed Data Sculptures that overcome the 3D printing industries focus on printing PRODUCTS:
- 3D Printing technology gets smarter (speed, materials, processes, colours, resolution, data collection by 3D scanners)- all of this driven by demanding client sectors ( medicine, aerospace etc.)
- “White noise”: The amount and volatility of strategic data that is constantly disseminated digitally invites new hybrid forms, i.e. more durable supplements, also to form new narratives. Architects and urban planners know what I mean when talking about the charm of physical models!
- Tangible Data Sculptures offer additional sensory values (Touch them, hand them round, watch them at eye level, feel the surface haptics): “Digital data is made to forget, analogue is made to remember” Robert Polidori, Canadian photographer).
- Due to the production process (CAD- based) you can easily turn your stuff into illustrations and animation clips to accompany presentations (see above). There will be interfaces to also blend into VR.
In the near future suitable 3D printed Data Sculptures may populate boards meetings, consultancy firms, redaction rooms and attain some intelligence. Put “screenland” behind you !
Bio: Volker Schweisfurth (mivoschweisfurth@arcor.de) has 35 years of experience as investment consultant in chemical industry and a development bank, designed some communication and visualization solutions. The new challenges of 3D printing technology have induced him to start working as a data artist with his startup MeliesArt.
See also
– Flight over the global economy (Youtube)
– 3D Printing Digital Data with ‘MeliesArt’(blog)
Related: