Tree Kernels: Quantifying Similarity Among Tree-Structured Data
An in-depth, informative overview of tree kernels, both theoretical and practical. Includes a use case and some code after the discussion.
By Dino Causevic.
A network or graph is a type of structured data in the form of nodes, with relationships between them described by links, or edges. Nodes and edges in a graph may have several attributes that may be numerical or categorical, or even more complex.
Today, a massive amount of data is available in the form of networks or graphs. For example, the World Wide Web, with its web pages and hyperlinks, social networks, semantic networks, biological networks, citation networks for scientific literature, and so on.
A tree is a special type of graph, and is naturally suited to represent many types of data. The analysis of trees is an important field in computer and data science. In this article, we will look at the analysis of the link structure in trees. In particular, we will focus on tree kernels, a method for comparing tree graphs to each other, allowing us to get quantifiable measurements of their similarities or differences. This an important process for many modern applications such as classification and data analysis.

Unsupervised Classification of Structured Data
Classification is an important component machine learning and data analysis. In general, classification can either be supervised or unsupervised. In supervised classification, the classes are already known, and a classification model is constructed from training data in which the correct classes are already given. Unsupervised classification, by contrast, attempts to identify classes where none are known, grouping data into categories based on some measure of their similarity.
Unsupervised classification can be combined with graph theory to identify groups of similar tree networks. Tree data structures are employed to model objects from several domains. In natural language processing (NLP), for example, parse trees are modelled as ordered, labelled trees. In automated reasoning, many problems are solved by searching, where the search space is represented as a tree whose vertices are associated with search states, and edges represent inference steps. Also, semistructured data, such as HTML and XML documents, can be modelled as ordered, labelled trees.
These domains can be usefully analysed through unsupervised classification techniques. In NLP, classification can be used to automatically group a set of sentences into questions, commands, and statements. Likewise, groups of similar websites can be identified by applying classification methods to their HTML source. In each of these cases, all we need is a way to measure how “similar” two trees are to each other.
The Curse of Dimensionality
Most classification algorithms require that data be transformed into a vectorized form, representing the values of the data’s features in the feature space, so that the data can by analyzed in the feature space using linear algebra. In structured or semistructured data, like trees, the dimensionality of the resultant vectors (that is, the number of features in the feature space) might be quite high, since the feature space must preserve information about the structure.
This may be a significant drawback, considering that many classification techniques are not able to scale effectively with the dimensionality of the input. In other words, their classification power decreases with an increase in the dimensionality of the input. This problem is known as the curse of dimensionality.
To get an idea of the reason for this degradation of performance, consider a space X of dimension d. Suppose that X contains a set of points uniformly distributed. If the number of dimensions of X increases, the number of points necessary to keep the same density must increase exponentially. In other words, the more the dimensions of the input, the more likely that that data is sparse. In general, a sparse dataset does not give enough information to build a good classifier because correlations between data elements are too weak for algorithms to detect.
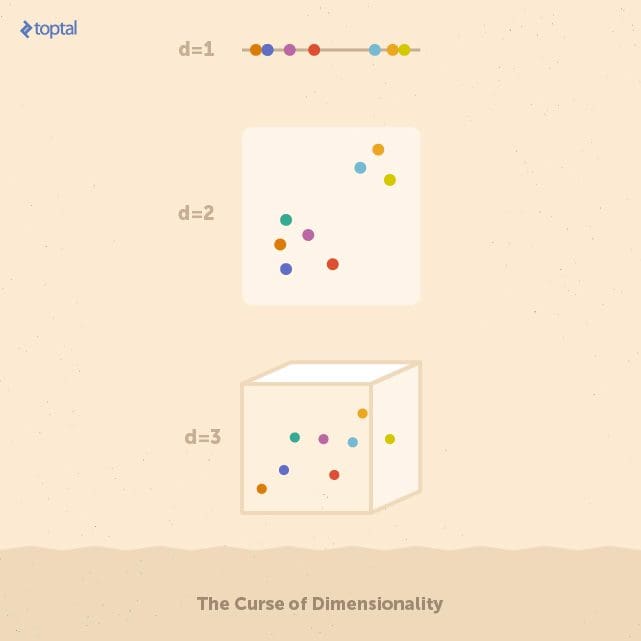
Each feature space above contains eight data points. On the one-dimensional space, it’s easy to identify a group of five points on the left, and three on the right. Stretching these points over higher numbers of features (i.e. dimensions) makes it more difficult to find these groups. In real applications, feature spaces can easily have hundreds of dimensions.
A vectorized representation for structured data is appropriate when information about the domain can be effectively used to select a manageable set of features. When such information is not available, it’s desirable to make use of techniques that can handle structured data directly, without performing operations in the vector space.