Brain Monitoring with Kafka, OpenTSDB, and Grafana
Interested in using open source software to monitor brain activity, and control your devices? Sure you are! Read this fantastic post for some insight and direction.
Running the Demo
Before running the demo, you’ll need git, scala, sbt and Docker (including docker-machine & docker-compose) installed. If you’re running Mac OS X, you can install them with Homebrew.
To run the demo, clone our GitHub repository so that you have a copy of the source code on your computer, and follow the instructions in the README, which will ask you to run the “build_and_run_demo.sh” shell script. The script will handle everything, but keep an eye on its output as it runs. By default, the script plays the pre-recorded data in a loop. If you wish to see the raw data from your Emotiv headset, run the script with the “-e” flag.
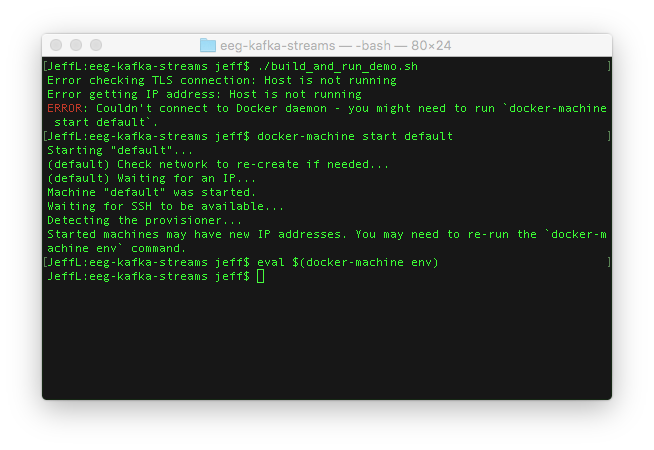
- If your Docker machine isn’t already up and running, you may need to start it and re-initialize Docker-specific environment variables.

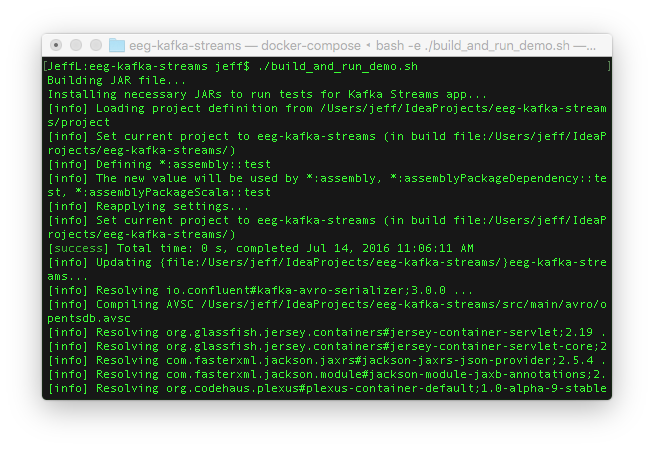
- The shell script will clone source code repositories from GitHub and build JAR files.
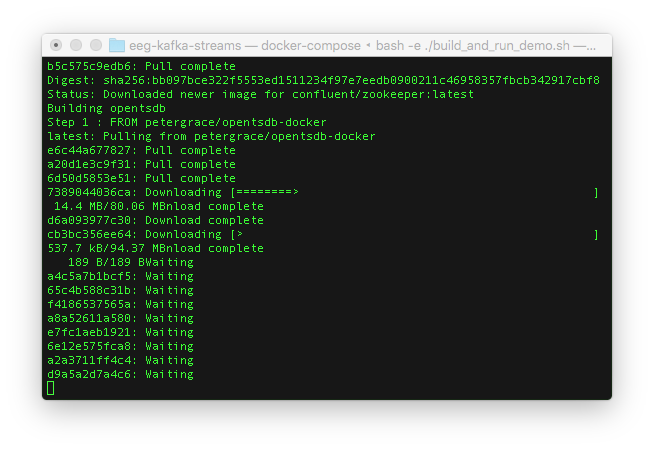
- Then it’ll download Docker images.
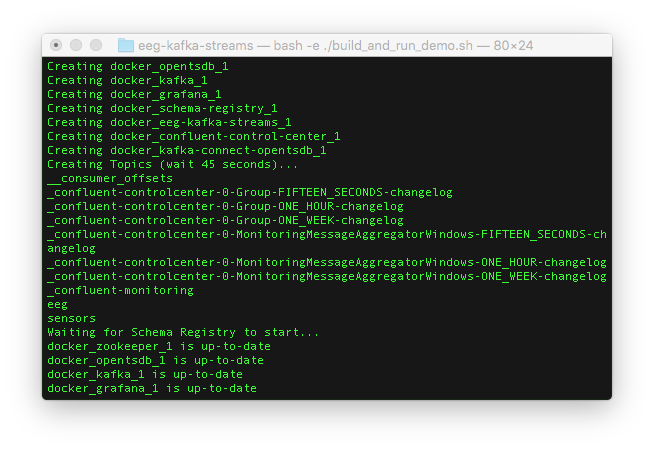
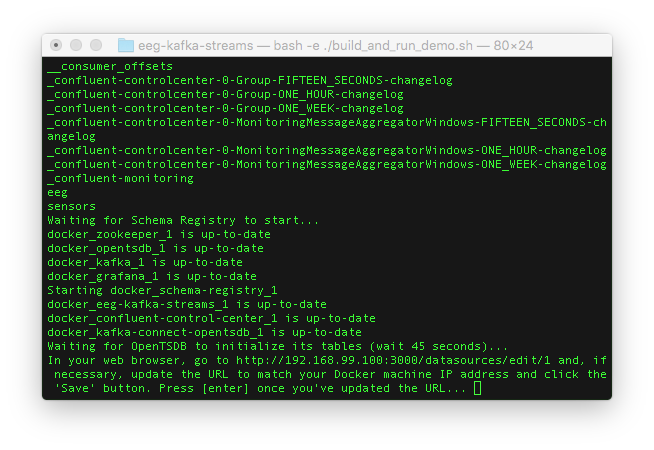
- After the Docker images are downloaded, the Docker containers will be spawned on your machine and Kafka topics will be created. You should see that the “sensors” and “eeg” topics are available.
- You’ll be asked to open the URL to your Docker container for Grafana.
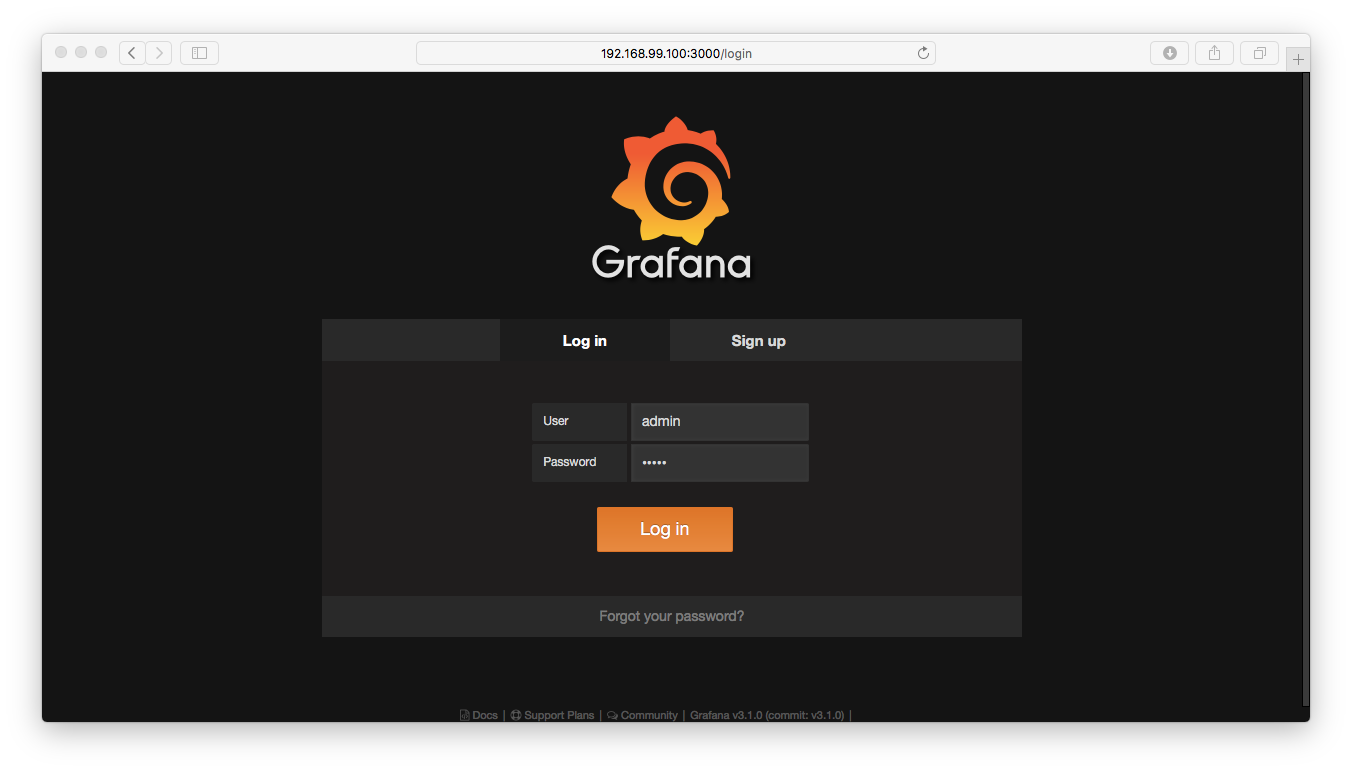
- You’ll need to login with “admin” as the username and “admin” as the password.
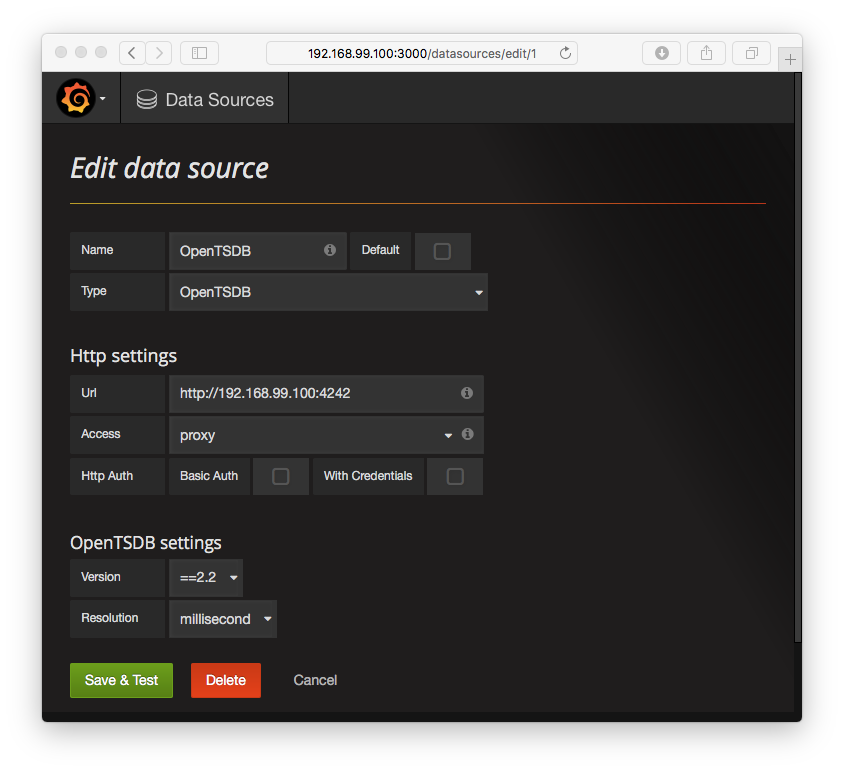
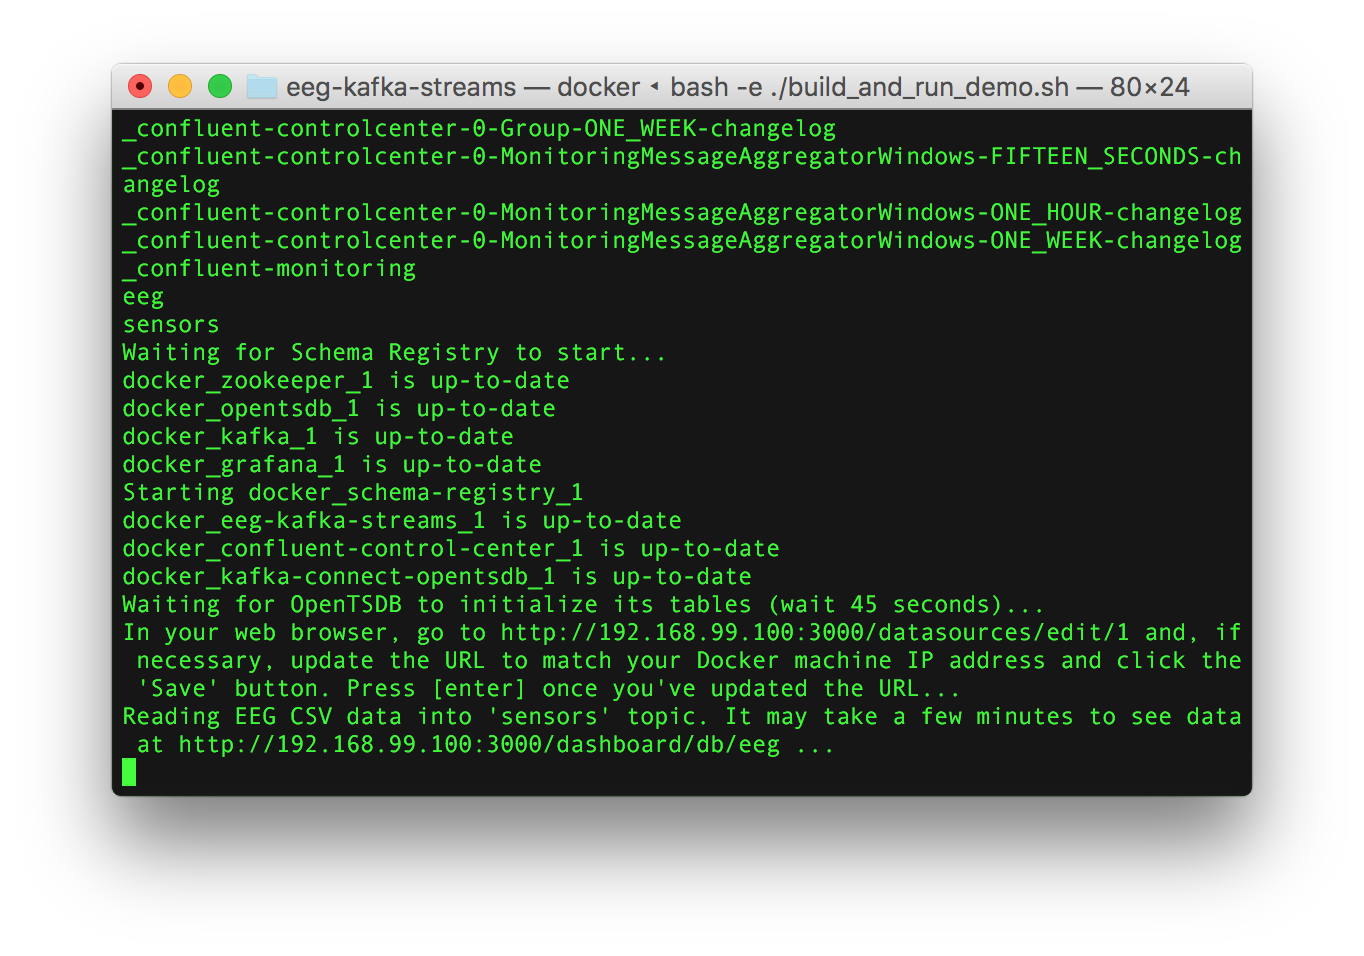
- Then you’ll be redirected to the administrative web page for configuring the database connection to OpenTSDB. The only thing you might need to change is the IP address in the URL text input field. The IP address is your Docker machine’s IP address and should match the one in your web browser. Here in the screenshot below, my Docker IP address is 192.168.99.100, so there is nothing for me to update.
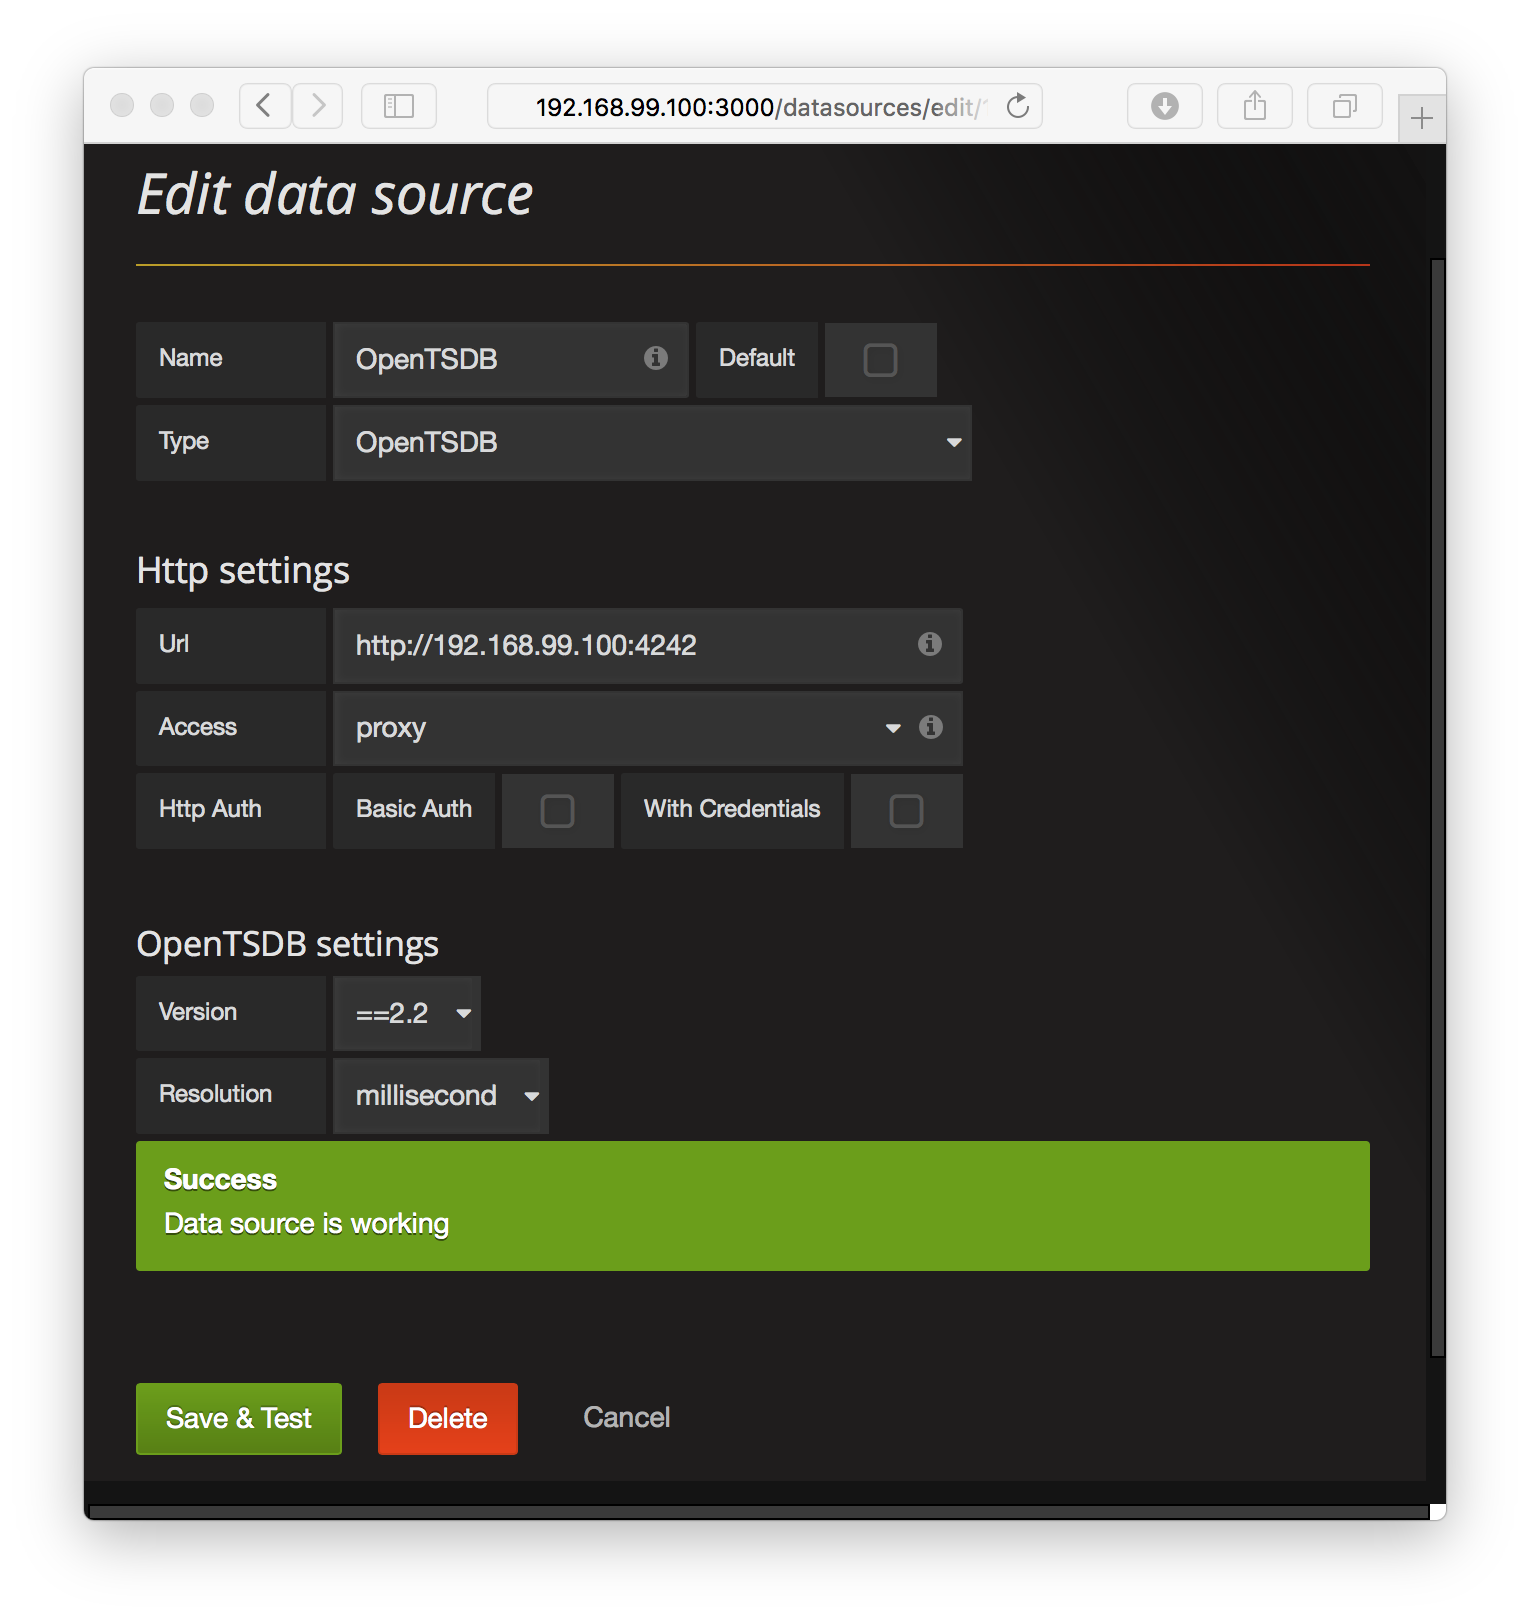
- Click the green “Save & Test” button and you should see a success dialog indicating that Grafana can indeed connect to OpenTSDB.
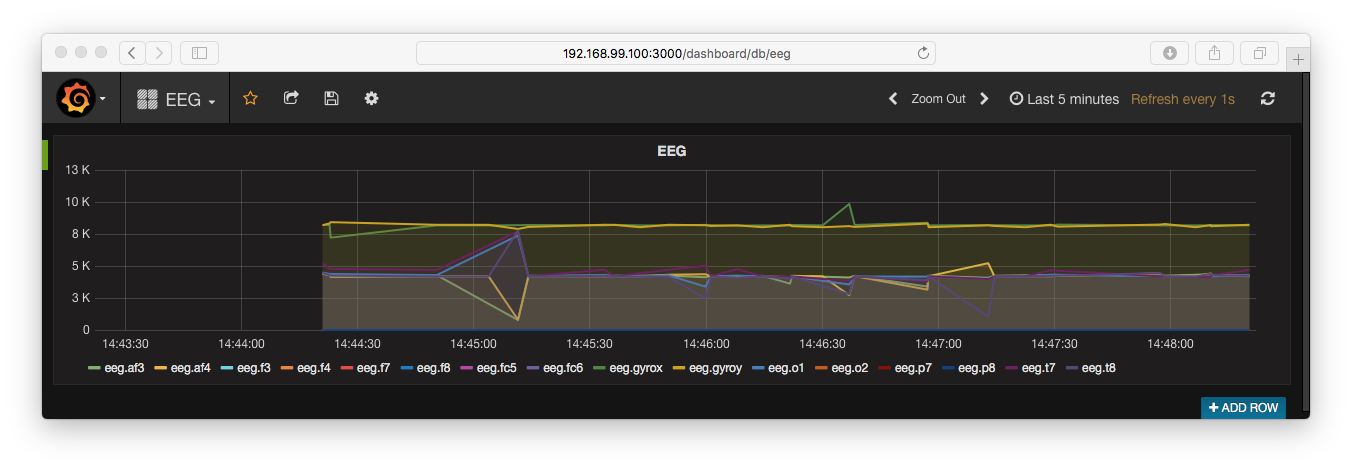
- Go back to your terminal and press the “enter” key to start streaming the example EEG data through the system. The URL to your EEG dashboard on Grafana will appear.
- Finally, go to the URL, and you’ll see the brain wave data in your web browser.