The Data Science of NYC Taxi Trips: An Analysis & Visualization
This post outlines using Google BigQuery for an analysis of NYC Taxi Trips in the cloud, presenting the analysis and visualization in Tableau Public for readers to interact with.
By Indu Khatri, Schulich School of Business, York University.
It feels like dream come true when you decide to work on a data which is truly “Big Data”. The data which is about to make me go gaga over it is NYC Taxi Trip Data. Thanks to open source technology believers who have helped many budding Data Scientists like me to learn and develop their skills. NYC Taxi & Limousine Commission shared almost 1.1 Billion taxi trips information in New York (from January 2009 to June 2015). The commission released newer version of 1.3 Billion taxi trips data (additional trips till June 2016).
It didn’t take me too long to realise that My Acer Laptop was totally outclassed when I tried exploring this data on it. Being Computer Scientist at Mind & Business Woman at Heart, I was looking for an alternative that can help me in testing my Data Scientist skills on this dataset. As always, Google turned out to be the solution as it is for most problems! I used Google BigQuery which stores massive datasets in the Cloud that can be explored using SQL queries. As Google says “BigQuery is Google's fully managed, petabyte scale, low cost analytics data warehouse”. (BigQuery docs).
To process with my analysis, I could have accessed multiple CSV files uploaded by NYC Taxi & Limousine Commission here: www.nyc.gov/html/tlc/html/about/trip_record_data.shtml. I could have used an ETL process to extract the data from these multiple CSV files and load in BigQuery but Google has already done that for me. If you are interested in the manual process, please refer this amazing blog: tech.marksblogg.com/billion-nyc-taxi-rides-bigquery.html.
BigQuery has Public Data Sets that can be explored and integrate into our software applications for Free (Priced/ Charged after a limit- You could look at the Pricing Calculator). BigQuery’s NYC TLC Trips public dataset has information till 2015 trips. This data include trips recorded from Yellow taxis in NYC. Here are the links of the data:
- cloud.google.com/bigquery/public-data/nyc-tlc-trips
- bigquery.cloud.google.com/dataset/bigquery-public-data:new_york
I decided to continue with my Analysis in following manner:
1. Explored TLC Yellow Taxi Trips data of 2015
Below is the table description of the data.
| Table ID | bigquery-public-data:new_york.tlc_yellow_trips_2015 |
| Table Size | 18.7 GB |
| Number of Rows | 146,112,989 |
2. Used BigQuery’s StandardSQL to analyze the DataSet
Here is the glimpse of the query that I used for my analysis:
3. Used Tableau to perform Explanatory Analysis
I am presenting my Tableau Story that shows the self-explanatory analysis of my three major Dashboards.
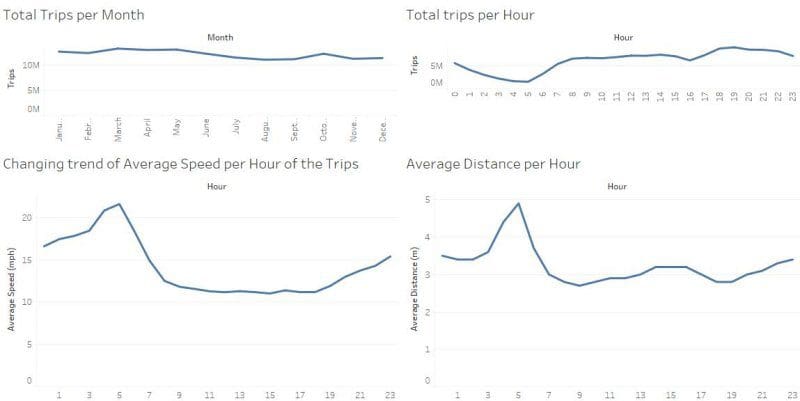
The first Dashboard talks about following Trends:
- Total Trips taken per Month,
- Total Trips taker per Hour,
- Average Speed taken by Yellow Taxis per Hour of trips,
- Average Distance travelled by Yellow Taxis per Hour
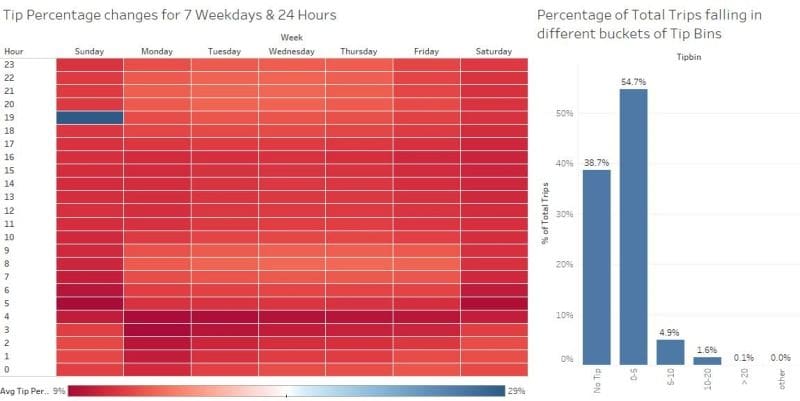
The second Dashboard talks about following Taxi Trip related information:
- The HeatMap shows Tip Percentage given to drivers (the data is divided in the 7 weeks day drame for 24 Hours),
- Percentage of Total trips falling in 5 different Tip Bins
The third Dashboard talks about following trends:
- Percentage of total taxi trips taking a certain average speed. Mostly average speed are between 5.50 and 39 mph,
- Percentage of total taxi trips travelling a certain average distance. Most trips are within short distances

Click here to explore the dashboards on Tableau Public.
PS: The next assignment that I will deal with is to perform Predictive Analysis. I plan to build a multi variate Regression model to find Tip Percentage for new trips. I hope you find this helpful. Share your comments and suggestions!
Bio: Indu Khatri is a Big Data & Machine Learning Enthusiast with a background in computer science and the recipient of multiple awards while working at Accenture & Cerner. She is currently pursuing her Master of Business Analytics at Schulich School of Business (York University, Toronto, Canada).
Related: