Proxy Indicators: beware of spurious claims
Beware of online and market research studies which can lead to false or spurious claims. We examine several notable examples including Google Street View and Argentina inflation.
By Ian White, Entrepreneurial product leader.

I recently stumbled across a research paper, Using Deep Learning and Google Street View to Estimate the Demographic Makeup of the US, which piqued my interest in derivative uses of data, an ongoing research interest of mine. A variety of deep learning techniques were used to draw conclusions about relationships of car ownership, political affiliation and demographics. For those headline skimmers, you may be led to believe that researchers have just uncovered a vastly cheaper and more timely approach to perform the national census and make predictive claims about the population.
The researchers’ contention that official statistics are expensive and lagging is spot on. The principal US unemployment survey is performed in person or via telephone. Mystery shoppers still go into the field to purchase the underlying goods in the Consumer Price Index. Monthly government statistics are typically released several weeks after the close of the period and revised multiple times. The more infrequent the release, the longer the tabulation period. And for good reason.
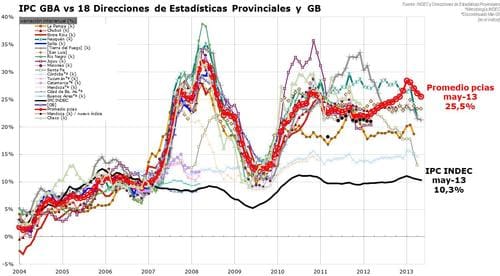
These are national statistics, and by government mandate are required to have a transparent, consistent and well-understood methodology. When countries lie, they get found out. Ask Argentina about bogus inflation statistics. And that wasn’t even the dumb part–the difference between provincial government and national stats (black line) during the time in question is obvious to anybody who can read a chart:
Or analyze online prices in Argentina, compute a price index and see a similar conclusion. This initiative turned into the Billion Prices Project at MIT and is one of the innumerable research projects that use novel/alternative approaches to measure macro trends in a timely manner. Other highlights include Google’s use of flu-related search terms to indicate current influenza rates (which worked until it didn’t). Or near-time reporting of unemployment rates across EU member states. But I digress…
The danger in relying on the Google Street View study cited above can lead to spurious claims when taken out of context. I’m sure the authors are rolling their eyes at the below because nobody is suggesting polling can be better performed by knowing automobile ownership (not to mention the bias).
For example, the vehicular feature that was most strongly associated with Democratic precincts was sedans, whereas Republican precincts were most strongly associated with extended-cab pickup trucks (a truck with rear-seat access). We found that by driving through a city for 15 minutes while counting sedans and pickup trucks, it is possible to reliably determine whether the city voted Democratic or Republican: if there are more sedans, it probably voted Democrat (88% chance) and if there are more pickup trucks, it probably voted Republican (82% chance).
Also, while interesting, commercial market research vendors, such as Experian Automotive, can tell you much of the same information without the heavy probabilistic approach. Other research approaches also exist. It is clear there is more than one way to skin a cat, but it’s difficult to know which method will yield desired results (this analogy is still under development).
Kudos to the research team in the technical domain, but in the context of survey design and generally synthesizing a body of research, they really missed the boat. With the flood of non-traditional data sources available it is easier than ever to make inferences that lead to cognitive and statistical over-fitting. Chris Anderson’s WIRED essay on the topic from nearly a decade ago was prescient and should be required reading.
Key findings from studies that rely on highly dimensional data can be used as hypotheses to further interrogate research where there are questions about data paucity or legitimacy. This is evident in the case of the Argentinian inflation rate and there are countless examples through the global supply chain, human migration patterns and consumer preferences. Research into big data/novel analytics could be advanced by considering the impact of these proxy indicators for the domain(s) in question. This would compel researchers to be more robust in research design and foster cross-disciplinary thinking.
Original. Reposted with permission.
Bio: Ian White is an entrepreneurial product leader with 20 years experience spanning product management and business strategy at the intersection of data science, geospatial software, business intelligence and data acquisition.
Related: