K-means Clustering with Tableau – Call Detail Records Example
We show how to use Tableau 10 clustering feature to create statistically-based segments that provide insights about similarities in different groups and performance of the groups when compared to each other.
Top and Bottom 10 Countries by Total Activity
This visualization is used to find out:
- Top 10 Countries producing more traffic with total activity.
- Bottom 10 Countries producing more traffic with total activity.
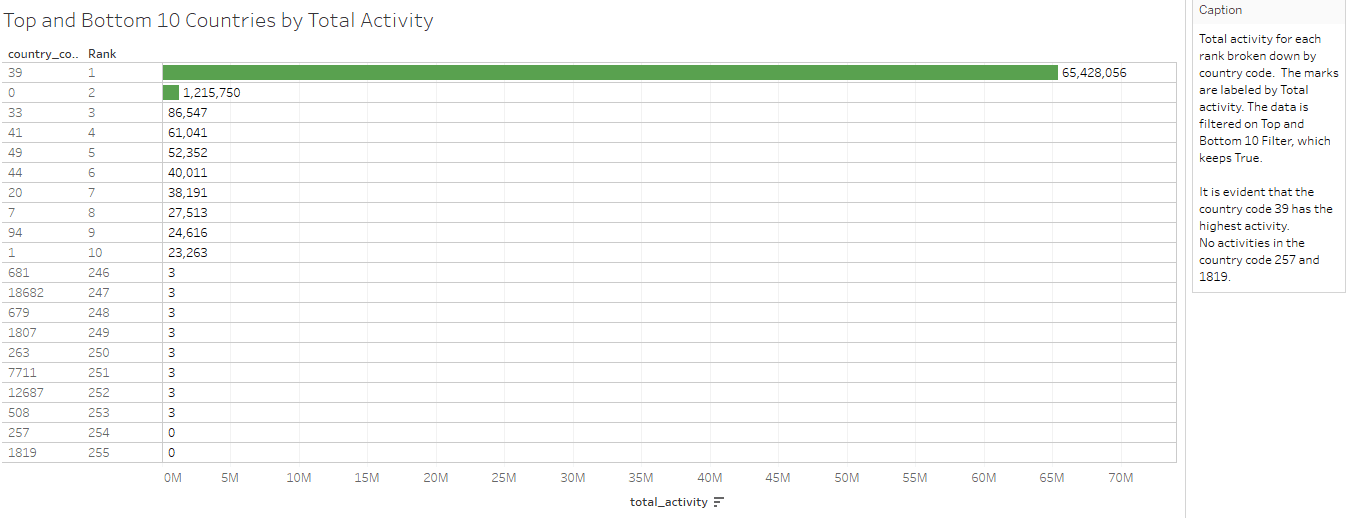
From the above visualization, it is evident that the country code 39 has the highest activity and no activities in the country codes 257 and 1819.
Note: Finding out top and bottom N in Tableau is pretty simple. We have created parameter, newly calculated field’s index, and Top and Bottom N filter to achieve that.
Call Detail Record Clustering in Tableau
Clustering in Tableau
If the number of clusters is not specified by a user, Tableau picks the number of clusters corresponding to the first local maximum of the Calinski-Harabasz index. Tableau uses the following:
- K-means algorithm for clustering.
- Lloyd’s algorithm with squared Euclidean distances to compute the k-means clustering for each k.
- Calinski-Harabasz criterion to assess cluster quality.
By default, K-means will be run for up to 25 clusters if the first local maximum of the index is not reached for a smaller value of k. A maximum value of 50 clusters can be set.
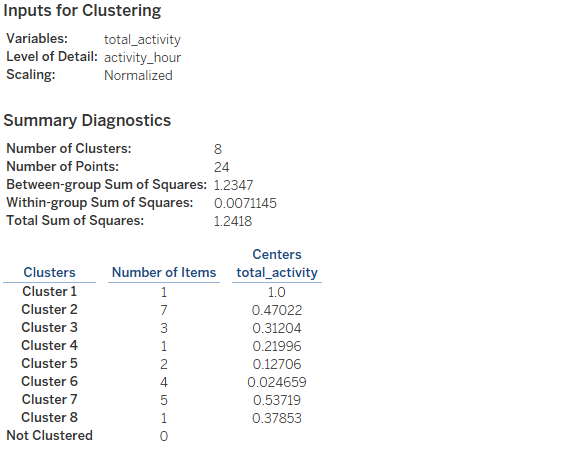
To determine optimal number of clusters (k), consider Between-group sum of squares (SSB), within group sum of squares (SSW), and total sum of squares from the cluster result.
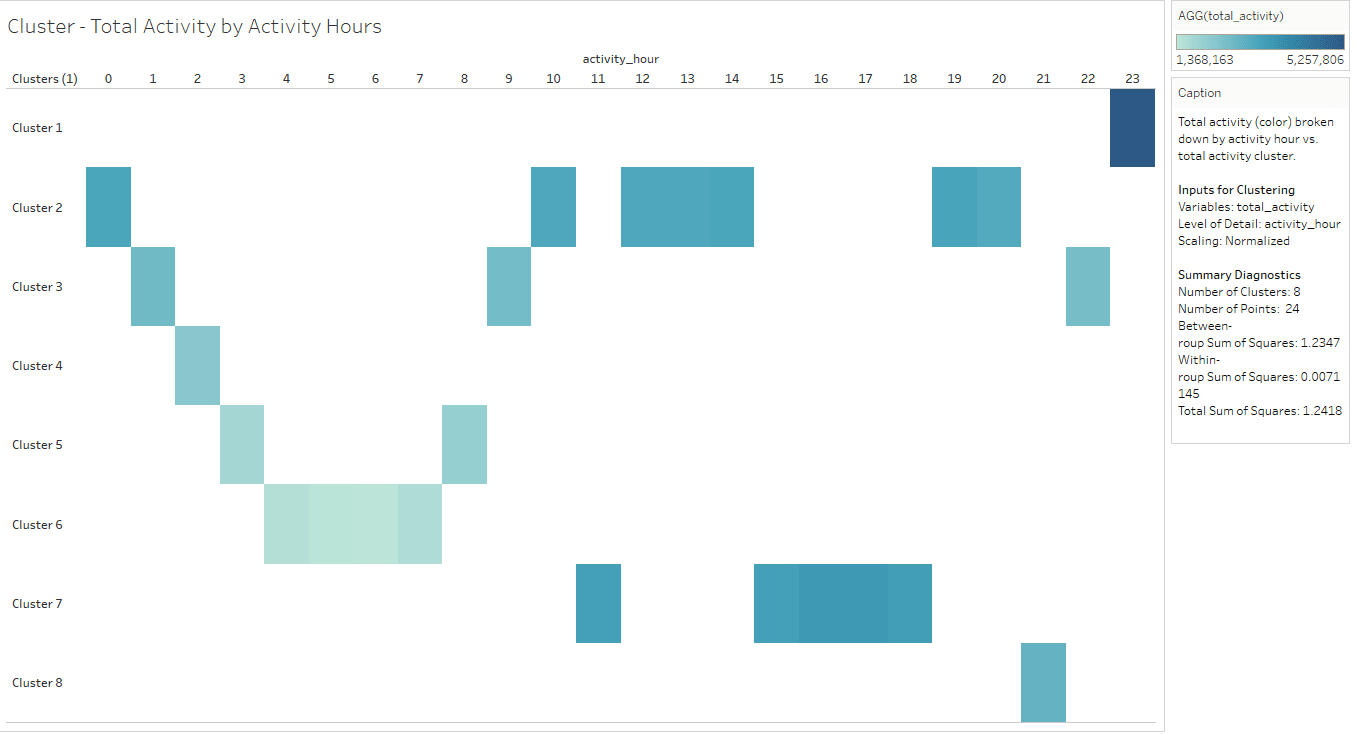
Total Activity by Activity Hours Cluster
Sometimes, data groupings make immediate sense. “total_activity” measure is used as a variable for clustering and K value is provided as 8.
The Describe clusters dialog box provides information about the models that Tableau computed for clustering. These statistics can be used to assess clustering quality.
Describe Clusters – Models Tab
Analysis of variance (ANOVA) is a collection of statistical models and associated procedures useful for analyzing variation within and between observations that have been partitioned into groups or clusters.
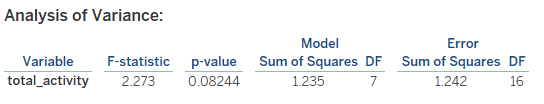
In this use case, ANOVA is computed for “total_activity” variable and the resulting analysis of variance table is used to determine “total_activity” variable effectiveness to distinguish clusters.
Describe Clusters – Summary Tab
The Summary tab identifies the inputs used to generate the clusters and provides some statistics characterizing the clusters.
The clusters are ranked using “Total Activity by Activity Hours” cluster from more to less traffic as follows:
- Cluster 1 produced more traffic activities, which include only activity hour 23.
- Cluster 7 is second and includes activity hours 11, 15, 16, 17, and 18.
- Cluster 2 is third and includes activity hours 0, 10, 12, 13, 14, 19, and 20.
- Cluster 8 is fourth and includes activity hour 21.
- Cluster 3 is fifth and includes activity hours 1, 9, and 22.
- Cluster 4 is sixth and includes activity hour 2.
- Cluster 5 is seventh and includes activity hours 3 and 8.
- Cluster 6 is less traffic and includes activity hours 4, 5, 6, and 7.
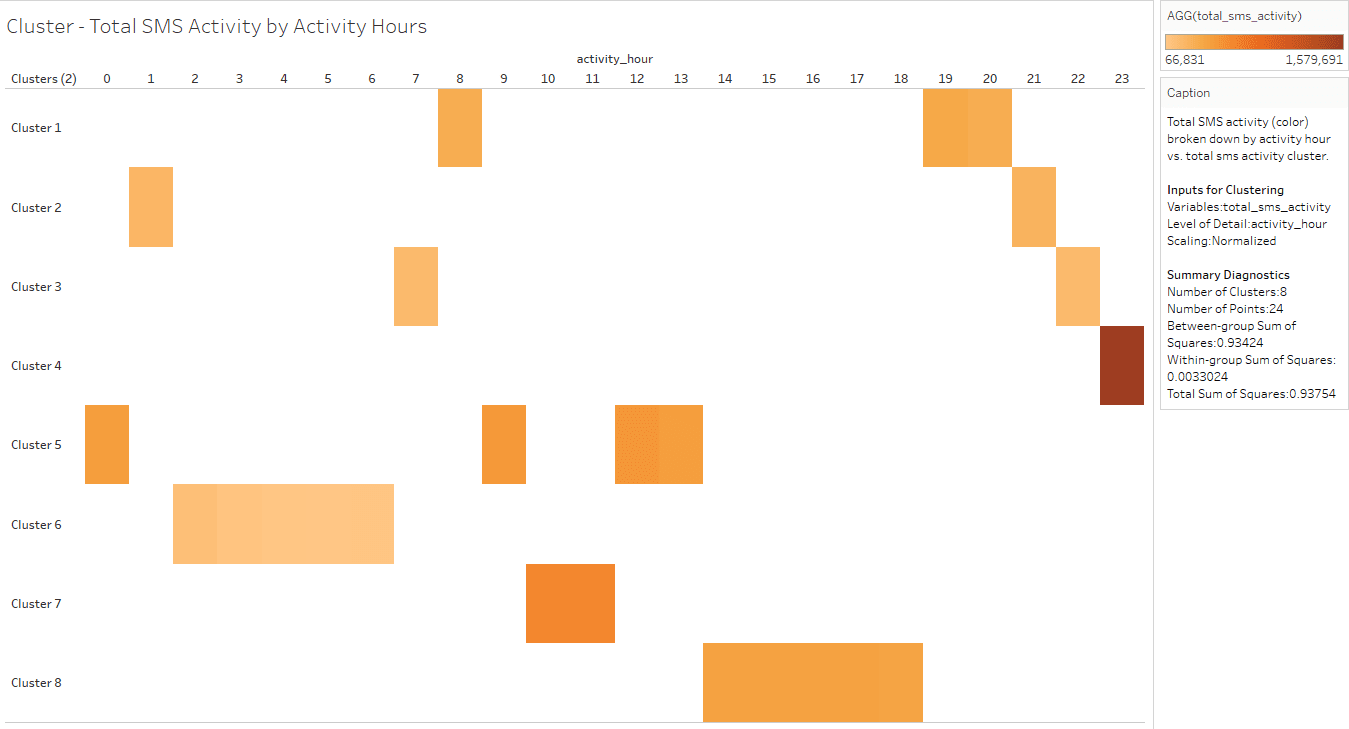
Total SMS Activity by Activity Hours Cluster
This cluster is based on “total_sms_activity” measure as the variable for clustering and K value provided as 8.
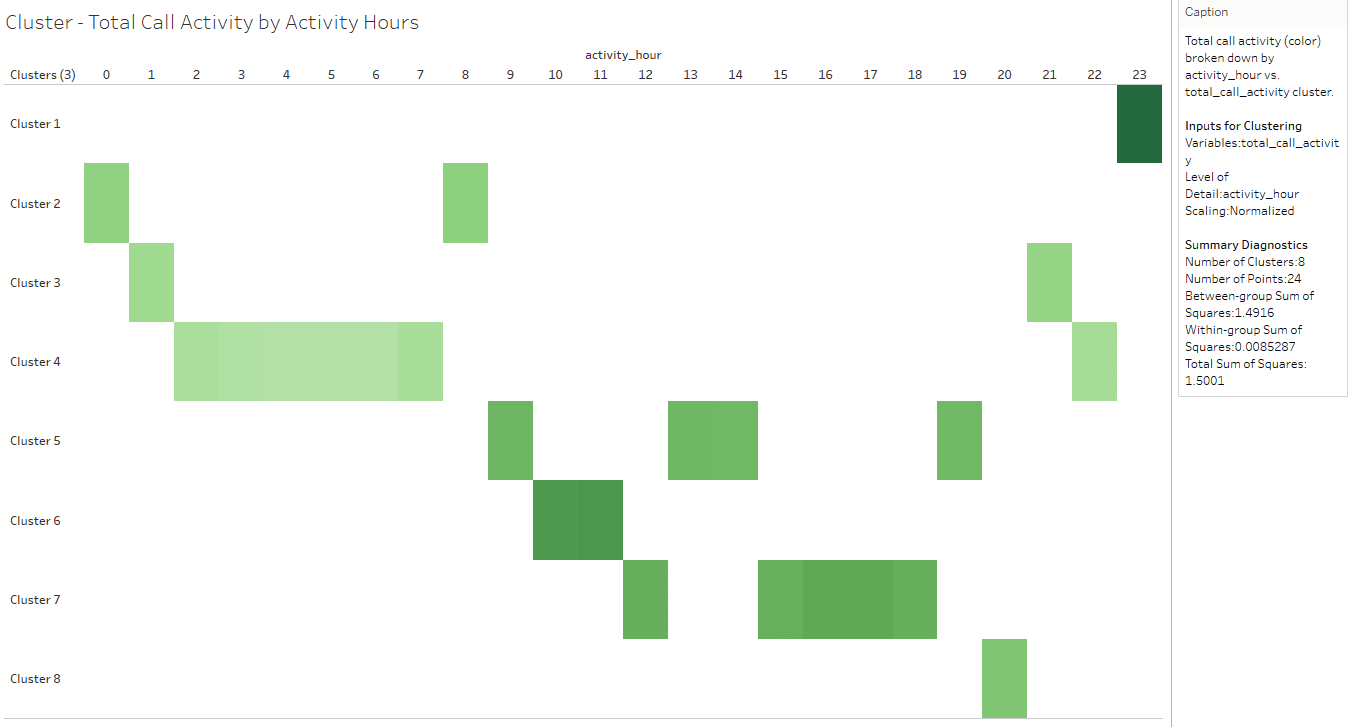
Total Call Activity by Activity Hours Cluster
This cluster is based on “total_call_activity” measure as the variable for clustering and K value provided as 8.
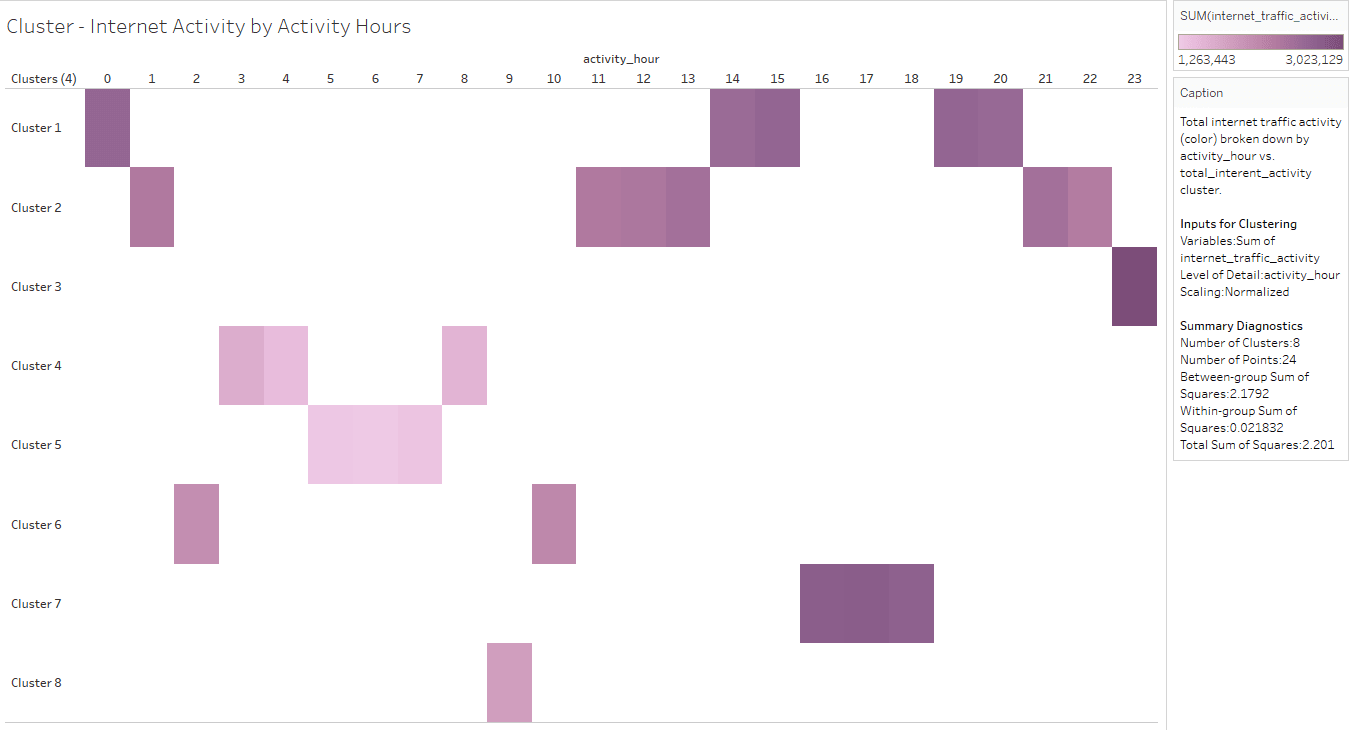
Internet Activity by Activity Hours Cluster
This cluster is based on “sum (internet_traffic_activity)” measure as the variable for clustering and K value provided as 8.
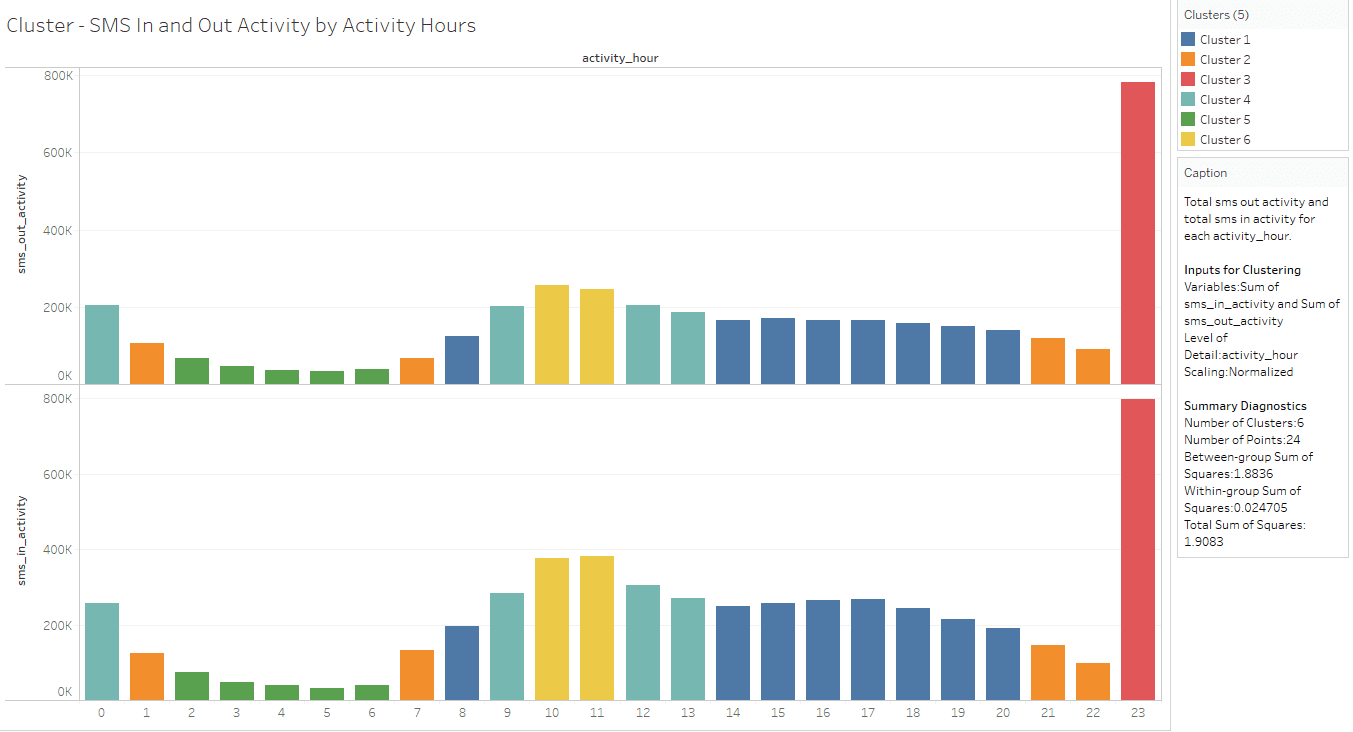
SMS In and Out Activity by Activity Hours Cluster
This cluster is based on “sum (sms_in_activity) and sum (sms_out_activity)” measures as the variable for clustering and K value provided as 6.
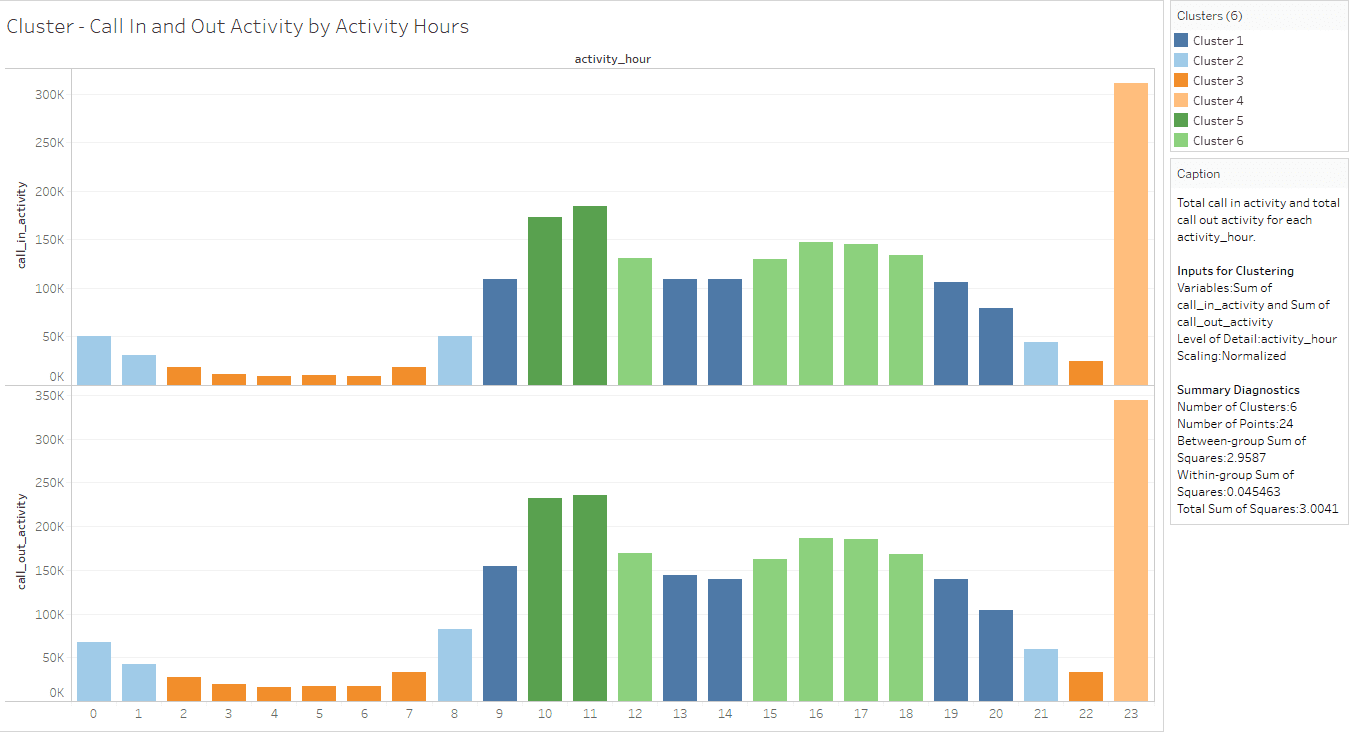
Call In and Out Activity by Activity Hours Cluster
This cluster is based on “sum (call_in_activity) and sum (call_out_activity)” measures as the variable for clustering and K value provided as 6.
CDR Analysis (by Treselle Systems)
Conclusion
By using this clustering mechanism, you can find the clusters making more traffic to the telecom network in the measure of total activity. Similarly, you can obtain more information like square grid and country code information to understand the square grid likely creating more revenue and more traffic to the telecom network and to target high customers based on their geo location.
References
Tableau workbook is available in the below GitHub location: https://github.com/treselle-systems/CDR_analysis_using_K_means_in_Tableau
How Clustering Works in Tableau: https://onlinehelp.tableau.com/current/pro/desktop/en-us/clustering_howitworks.html
Statistics for Clustering: http://onlinehelp.tableau.com/v10.2/pro/desktop/en-us/help.html#clustering_description.html
Bio: Rathnadevi Manivannan is working as a Senior Technical Writer in Treselle Systems, experienced and passionate about writing on different technologies and domains such as Big Data, Cloud Computing, Virtualization, Storage, Data Analytics, Business Analytics.
Related: