Comparing Distance Measurements with Python and SciPy
This post introduces five perfectly valid ways of measuring distances between data points. We will also perform simple demonstration and comparison with Python and the SciPy library.
Clustering, or cluster analysis, is used for analyzing data which does not include pre-labeled classes. Data instances are grouped together using the concept of maximizing intraclass similarity and minimizing the similarity between differing classes. This translates to the clustering algorithm identifying and grouping instances which are very similar, as opposed to ungrouped instances which are much less-similar to one another. As clustering does not require the pre-labeling of classes, it is a form of unsupervised learning.
At the core of cluster analysis is the concept of measuring distances between a variety of different data point dimensions. For example, when considering k-means clustering, there is a need to measure a) distances between individual data point dimensions and the corresponding cluster centroid dimensions of all clusters, and b) distances between cluster centroid dimensions and all resulting cluster member data point dimensions.
While k-means, the simplest and most prominent clustering algorithm, generally uses Euclidean distance as its similarity distance measurement, contriving innovative or variant clustering algorithms which, among other alterations, utilize different distance measurements is not a stretch. Translation: using different techniques for cluster-related distance measurement is quite easily doable. However, the reasons for actually doing so would require great knowledge of both domain and data.
We will leave the "why" of pursuing particular distance measurements out of this discussion, and instead quickly introduce five perfectly valid ways of measuring distances between data points. We will also perform simple demonstration and comparison with Python and the SciPy library. For more on the distance measurements that are available in the SciPy spatial.distance module, see here.
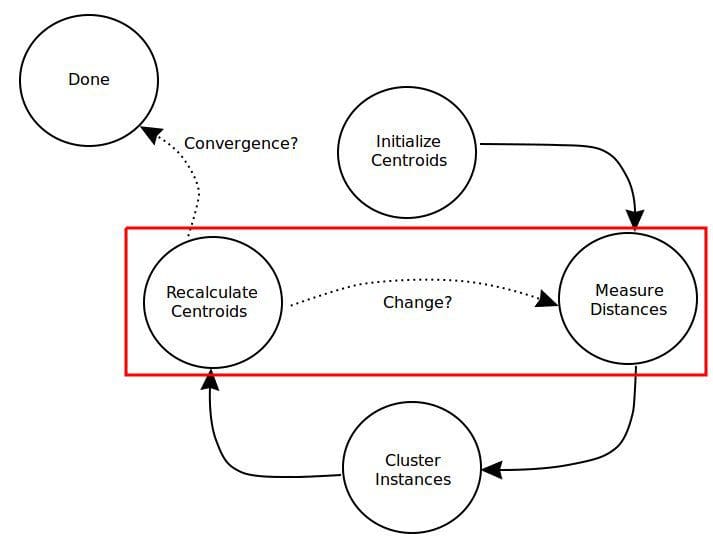
Fig. 1: Distance measurement plays an important role in clustering.
A simple overview of the k-means clustering algorithm process, with the distance-relevant steps pointed out.
Euclidean
We may as well begin with the all-time Euclidean space distance measurement champion. Euclidean distance is the "'ordinary' straight-line distance between two points in Euclidean space."
As a reminder, given 2 points in the form of (x, y), Euclidean distance can be represented as:

Manhattan
Manhattan -- also city block and taxicab -- distance is defined as "the distance between two points is the sum of the absolute differences of their Cartesian coordinates."

Fig. 2: Visualization of Manhattan geometry in blue (the staircase), Euclidean in green (the straight line) (Source: Wikipedia).
Chebyshev
Chebyshev -- also chessboard -- distance is best defined as a distance metric "where the distance between two vectors is the greatest of their differences along any coordinate dimension."
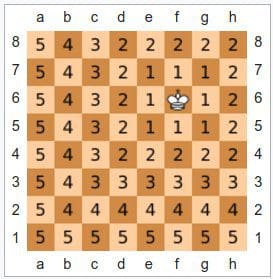
Fig. 3: Chebyshev visualized using the chessboard (Source: Wikipedia).
Canberra
Canberra distance is a weighted version of Manhattan distance, which "has been used as a metric for comparing ranked lists and for intrusion detection in computer security."
Canberra distance can be represented as

where p and q are vectors and

Cosine
Cosine similarity is defined as:
...a measure of similarity between two non-zero vectors of an inner product space that measures the cosine of the angle between them. The cosine of 0° is 1, and it is less than 1 for any other angle. It is thus a judgment of orientation and not magnitude: two vectors with the same orientation have a cosine similarity of 1, two vectors at 90° have a similarity of 0, and two vectors diametrically opposed have a similarity of -1, independent of their magnitude. Cosine similarity is particularly used in positive space, where the outcome is neatly bounded in [0,1].
Cosine similarity is often used in clustering to assess cohesion, as opposed to determining cluster membership.
Python and SciPy Comparison
Just so that it is clear what we are doing, first 2 vectors are being created -- each with 10 dimensions -- after which an element-wise comparison of distances between the vectors is performed using the 5 measurement techniques, as implemented in SciPy functions, each of which accept a pair of one-dimensional vectors as arguments. Second, a pair of 100-dimension vectors are created, with the same set of distance measurements performed and reported.
10-dimensional vectors
------------------------
[ 3.77539984  0.17095249  5.0676076   7.80039483  9.51290778  7.94013829
  6.32300886  7.54311972  3.40075028  4.92240096]
[ 7.13095162  1.59745192  1.22637349  3.4916574   7.30864499  2.22205897
  4.42982693  1.99973618  9.44411503  9.97186125]

Distance measurements with 10-dimensional vectors
-------------------------------------------------
Euclidean distance is 13.435128482
Manhattan distance is 39.3837553638
Chebyshev distance is 6.04336474839
Canberra distance is 4.36638963773
Cosine distance is 0.247317394393

Distance measurements with 100-dimensional vectors
--------------------------------------------------
Euclidean distance is 42.6017789666
Manhattan distance is 359.435547878
Chebyshev distance is 9.06282495069
Canberra distance is 40.8173353649
Cosine distance is 0.269329456631
With the measurements performed, we can quickly notice 2 important takeaways:
- The reported distances (obviously) vary greatly between distance measurement techniques
- Some measurement techniques are more susceptible (at least, in this experiment) to increased dimensionality (while, conversely, others are much less-influenced)
While no grand conclusions can be drawn from this simple overview and presentation, the results should also put this excerpt from Hastie, Tibshirani and Friedman's Elements of Statistical Learning in perspective:
An appropriate dissimilarity measure is far more important in obtaining success with clustering than choice of clustering algorithm. This aspect of the problem ... depends on domain specific knowledge and is less amenable to general research.
It's also important to note that the key idea of distance, as it relates to cluster analysis, is not the exact value of the measurements, but how the resulting measurements are used to groups the data points. For example, if you multiply each measure by 100, the values will be different, but the resulting clustering remains the same.
When considering "clustering," far too many people tend to think only of throwing their dataset at k-means, with the defaults. Hopefully this short post has shed some light on the potential complexities and implications of clustering algorithms and their components.
Related: