Understanding overfitting: an inaccurate meme in Machine Learning
Applying cross-validation prevents overfitting is a popular meme, but is not actually true – it more of an urban legend. We examine what is true and how overfitting is different from overtraining.
By Mehmet Suzen, U. of Frankfurt .
This post was inspired by a recent post by Andrew Gelman, who defined ‘overfitting’ as follows:
Overfitting is when you have a complicated model that gives worse predictions, on average, than a simpler model.
Preamble
There is a lot of confusion among practitioners regarding the concept of overfitting. It seems like, a kind of an urban legend or a meme, a folklore is circulating in data science or allied fields with the following statement:
Applying cross-validation prevents overfitting and a good out-of-sample performance, low generalisation error in unseen data, indicates not an overfit.
This statement is of course not true: cross-validation does not prevent your model to overfit and good out-of-sample performance does not guarantee not-overfitted model. What actually people refer to in one aspect of this statement is called overtraining. Unfortunately, this meme is not only propagated in industry but in some academic papers as well. This might be at best a confusion on jargon. But, it will be a good practice if we set the jargon right and clear on what do we refer to when we say overfitting, in communicating our results.
Aim
In this post, we will give an intuition on why model validation as approximating generalization error of a model fit and detection of overfitting can not be resolved simultaneously on a single model. We will work on a concrete example workflow in understanding overfitting, overtraining and a typical final model building stage after some conceptual introduction. We will avoid giving a reference to the Bayesian interpretations and regularisation and restrict the post to regression and cross-validation. While regularisation has different ramification due to its mathematical properties and prior distributions have different implications in Bayesian statistics. We assume an introductory background in machine learning, so this is not a beginners tutorial.
A recent question from Andrew Gelman, a Bayesian guru, regarding What is overfitting? was one of the reasons why this post is developed along with my frustration to see practitioners being muddy on the meaning of overfitting and continuing recently published data science related technical articles circulating around and even in some academic papers claiming the above statement.
What do we need to satisfy in supervised learning?
One of the most basic tasks in mathematics is to find a solution to a function: If we restrict ourselves to real numbers in n-dimensions and our domain of interest would be Rn. Now imagine set of p points living in this domain xi form a dataset, this is actually a partial solution to a function. The main purpose of modelling is to find an explanation of the dataset, meaning that we need to determine m-parameters, a∈Rm which are unknown. (Note that a non-parametric model does not mean no parameters.) Mathematically speaking this manifests as a function as we said before, f(x,a). This modelling is usually called regression, interpolation or supervised learning depending on the literature you are reading. This is a form of an inverse problem, while we don’t know the parameters but we have a partial information regarding variables. The main issue is that solutions are not well-posed. Omitting axiomatic technical details, practical problem is that we can find many functions f(x,a) or models, explaining the dataset.
So, we seek the following two concepts to be satisfied by our model solution, f(x,a)=0.
1. Generalized: A model should not depend on the dataset. This step is called model validation.
2. Minimally complex: A model should obey Occam’s razor or principle of parsimony. This step is called model selection.
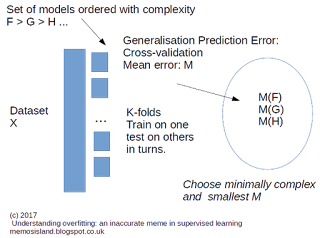
Figure 1: A workflow for model validation and selection in supervised learning.
Generalization of a model can be measured by goodness-of-fit. It essentially tells us how good our model (chosen function) explains the dataset. To find a minimally complex model requires comparison against another model.
Up to now, we have not named a technique how to check if a model is generalized and selected as the best model. Unfortunately, there is no unique way of doing both and that’s the task of data scientist or quantitative practitioner that requires human judgement.
Model validation: An example
One way to check if a model is generalized enough is to come up with a metric on how good it explains the dataset. Our task in model validation is to estimate the model error. For example, root mean square deviation (RMDS) is one metric we can use. If RMSD is low, we could say that our model fit is good, ideally it should be close to zero. But it is not generalized enough if we use the same dataset to measure the goodness-of-fit. We could use different dataset, specially out-of-sample dataset, to validate this as much as we can, i.e. so called hold out method. Out-of-sample is just a fancy way of saying we did not use the same dataset to find the value of parameters a. An improved way of doing this is cross-validation. We split our dataset into k partitions, and we obtain k RMDS values to averaged over. This is summarised in Figure 1. Note that, different parameterisation of the same model does not constitute a different model.
Model Selection: Detection of overfitting
Overfitting comes into play when we try to satisfy ‘minimally complex model’. This is a comparison problem and we need more than one model to judge if a given model is an overfit. Douglas Hawkins in his classic paper The Problem of Overfitting, states that
Overfitting of models is widely recognized as a concern. It is less recognized however that overfitting is not an absolute but involves a comparison. A model overfits if it is more complex than another model that fits equally well.
The important point here what do we mean by complex model, or how can we quantify model complexity? Unfortunately, again there is no unique way of doing this. One of the most used approaches is that a model having more parameters is getting more complex. But this is again a bit of a meme and not generally true. One could actually resort to different measures of complexity. For example, by this definition f1(a,x)=ax and f2(a,x)=ax2 have the same complexity by having the same number of free parameters, but intuitively f2 is more complex, while it is nonlinear. There are a lot of information theory based measures of complexity but discussion of those are beyond the scope of our post. For demonstration purposes, we will consider more parameters and degree of nonlinearity as more complex a model.
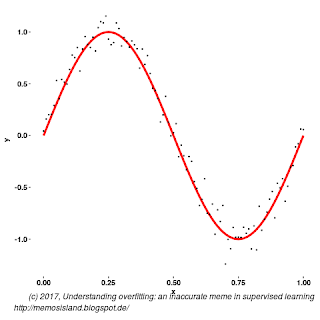
Figure 2: Simulated data and the non-stochastic part of the data.
Hand on example
We have intuitively covered the reasons behind how we can’t resolve model validation and judge overfitting simultaneously. Now try to demonstrate this with a simple dataset and models, yet essentially capturing the above premise.
A usual procedure is to generate a synthetic dataset, or simulated dataset, from a model, as a gold standard and use this dataset to build other models. Let’s use the following functional form, from classic text of Bishop, but with an added Gaussian noise
We generate large enough set, 100 points to avoid sample size issue discussed in Bishop’s book, see Figure 2. Let’s decide on two models we would like to apply to this dataset in supervised learning task. Note that, we won’t be discussing Bayesian interpretation here, so equivalency of these model under a strong prior assumption is not an issue as we are using this example for ease of demonstrating the concept. A polynomial model of degree 3 and degree 6, we call them g(x) and h(x) respectively, are used to learn from the simulated data.
and
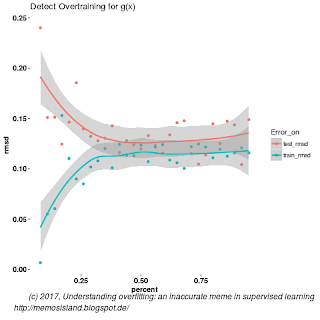
Figure 3: Overtraining occurs at around after 40 percent of the data usage for g(x).
Overtraining is not overfitting
Overtraining means a model performance degrades in learning model parameters against an objective variable that effects how model is build, for example, an objective variable can be a training data size or iteration cycle in neural network. This is more prevalent in neural networks (see Dayhoff 2011). In our practical example, this will manifest in hold out method to measure RMSD in modelling with g(x). In other words finding an optimal number of data points to use to train the model to give a better performance on unseen data, See Figure 3 and 4.
Overfitting with low validation error
We can also estimate 10-fold cross-validation error, CV-RMSD. For this sampling, g and h have 0.13 and 0.12 CV-RMSD respectively. So as we can see, we have a situation that more complex model reaches similar predictive power with cross validation and we can not distinguish this overfitting by just looking at CV-RMSD value or detecting ‘overtraining’ curve from Figures 4. We need two models to compare, hence both Figure 3 and 4, with both CV-RMSD values. We might argue that in small data sets we might be able tell the difference by looking at test and training error differences, this is exactly how Bishop explains overfitting; where he points out overtraining in small datasets.
Which trained model to deploy?
Now the question is, we found out best performing model with minimal complexity empirically. All well, but which trained model should we use in production?
Actually we have already build the model in model selection. In above case, since we got similar
predictive power from g and h, we obviously will use g, trained on the splitting sweet spot from Figure 3.
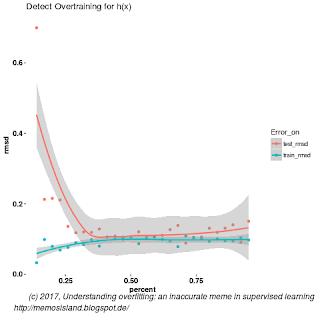
Figure 4: Overtraining occurs at around after 30 percent of the data usage for h(x)
Conclusion
The essential message here is good validation performance would not guarantee the detection of an overfitted model. As we have seen from examples using synthetic data in one dimension. Overtraining is actually what most practitioners mean when they use the term overfitting.
Outlook
As more and more people are using techniques from machine learning or inverse problems, both in academia and industry, some key technical concepts are deviated a bit and take different definitions and meaning for different people, due to the fact that people learn some concepts not from reading the literature carefully but from their line managers or senior colleagues verbally. This creates memes which are actually wrong or at least creating lots of confusion in jargon. It is very important for all of us as practitioners that we must question all technical concepts and try to seek origins from the published scientific literature and not rely entirely on verbal explanations from our experienced colleagues. Also, we should strongly avoid ridiculing question from colleagues even they sound too simple, at the end of the day we don’t stop learning and naive looking questions might have very important consequences in fundamentals of the field.
P.S. As I mentioned above, the inspiration of writing this post was, a recent post from Gelman (post). He defined ‘overfitting’ as follows:
Overfitting is when you have a complicated model that gives worse predictions, on average, than a simpler model.
Priors and equivalence of two models aside, Gelman’s definition is weaker than Hawkins definition, that he accepts a complex model having a similar predictive power. So, if we use Gelman’s definitions it is ok to deploy either of g or hin our toy example above. But strictly speaking from Hawkins perspective we need to deploy g.
Original. Reposted with permission.
Bio: Dr. Mehmet Suzen is a Theoretical Physicist and Research Scientist. He blogs on data science at Memos’ Island.
Related: