Evaluating Data Science Projects: A Case Study Critique
It’s not necessary to understand the inner workings of a machine learning project, but you should understand whether the right things have been measured and whether the results are suited to the business problem. You need to know whether to believe what data scientists are telling you.
By Tom Fawcett, Silicon Valley Data Science.

I’ve written two blog posts on evaluation—the broccoli of machine learning. There are actually two closely related concerns under the rubric of evaluation:
- Model evaluation is typically taught to data scientists and concerns the technical quality of a model: How well does the model perform? Can we trust the numbers? Are they statistically significant?
- Project evaluation includes model evaluation, but also asks questions of the application context: Is the right problem being solved? Is the performance metric appropriate to the task? How are the data being provided and how is the model result used? Are the costs acceptable?
Both types are important not only to data scientists but also to managers and executives, who must evaluate project proposals and results. To managers I would say: It’s not necessary to understand the inner workings of a machine learning project, but you should understand whether the right things have been measured and whether the results are suited to the business problem. You need to know whether to believe what data scientists are telling you.
To this end, here I’ll evaluate a machine learning project report. I found this work described as a customer success story on a popular machine learning blog. The write-up was posted in early 2017, along with a related video presenting the results. Some aspects are confusing, as you’ll see, but I haven’t sought clarification from the authors because I wanted to critique it just as reported. This makes for a realistic case study: you often have to evaluate projects with missing or confusing details.
As you’ll see, we’ll uncover some common application mistakes that even professional data scientists can make.
The Problem
The problem is presented as this: A large insurance company wants to predict especially large insurance claims. Specifically, they divide their population into drivers who report an accident (7–10%), drivers who have no accidents (90–93%), and so-called large-loss drivers who report an accident involving damages of $10,000 or more (about 1% of their population). It is only the last group involved in large, expensive claims that they want to detect. They are facing a two-class problem, whose classes they call Large Loss and Non-Large Loss.
Readers acquainted with my prior posts may recall I’ve talked about how common unbalanced classes are in real-world machine learning problems. Indeed, here we see a 99:1 skew where the positive (Large-Loss) instances are outnumbered by the uninteresting negative instances by about two orders of magnitude. (By the way, this would be considered very skewed by ML research standards, though it’s on the lighter side by real-world standards.) Because of this skew, we have to be careful in evaluation.
The Approach
Their approach was fairly straightforward. They had a historical data sample of previous drivers’ records on which to train and test. They represented each driver’s record using 70 features, encompassing both categorical and numerical features, although only a few of these are shown.
They state that their client had previously used a Random Forest to solve this problem. A Random Forest is a well known and popular technique that builds an ensemble of decision trees to classify instances. They hope to do better using a deep learning neural network. Their network design looks like this:

The model is a fully connected neural network with three hidden layers, with a ReLU as the activation function. They state that data from Google Compute Engine was used to train the model (implemented in TensorFlow), and Cloud Machine Learning Engine’s HyperTune feature was used to tune hyperparameters.
I have no reason to doubt their representation choices or network design, but one thing looks odd. Their output is two ReLU (rectifier) units, each emitting the network’s accuracy (technically: recall) on that class. I would’ve chosen a single Softmax unit representing the probability of Large Loss driver, from which I could get a ROC or Precision-Recall curve. I could then threshold the output to get any achievable performance on the curve. (I explain the advantages of scoring over hard classification in this post.)
But I’m not a neural network expert, and the purpose here isn’t to critique their network design, just their general approach. I assume they experimented and are reporting the best performance they found.
The Results
Their method of presenting test results is confusing. At the very outset, they report 78% accuracy—which is odd, both because accuracy is an uninformative measure for this skewed domain and because simply always saying Non-Large Loss should yield 99% accuracy. These two points are not unrelated.
But further down they show this as their end result:

The graph is missing x and y markings, so it’s hard to get much out of the curves. The only information is at the top. They are reporting two accuracies, one for each class. This changes things—they’re not using composite classification accuracy (the common meaning of “accuracy”) but the recall on each class. We can calculate some of the information to evaluate their system. Is it enough?
The Large Loss accuracy (recognition rate) is 0.78. By convention, the rare class is usually positive, so this means the True Positive (TP) rate is 0.78, and the False Negative rate (1 – True Positive rate) is 0.22. The Non-Large Loss recognition rate is 0.79, so the True Negative rate is 0.79 and the False Positive (FP) rate is 0.21.
What they had previously reported as Random Forest Accuracy is 0.39. Now we realize that this value is really the single-class recognition rate on the Large Loss class, so it is the Random Forest’s True Positive rate. They don’t report a False Positive rate (or True Negative rate, from which we could have calculated it). That’s a problem.
That concludes their report.
Critique
The first criticism is fairly obvious. They report only a single run of training and testing, so regardless of any other issues we really have only a single result to work with. We should want multiple runs using cross-validation or bootstrap to provide an indication of variation. As it is, we have no confidence that these numbers are representative. Most Machine Learning courses introduce the student to basic model evaluation and emphasize the need for multiple evaluations to establish confidence regions.
So how good is their solution?
Bottom line: We don’t know. They haven’t given us enough information. Probably not as good as they think.
Here is an ROC curve illustrating the classifiers. Such diagrams allow us to see the performance as a trade-off between sensitivity and specificity (equivalently, between False Positives and True Positives).
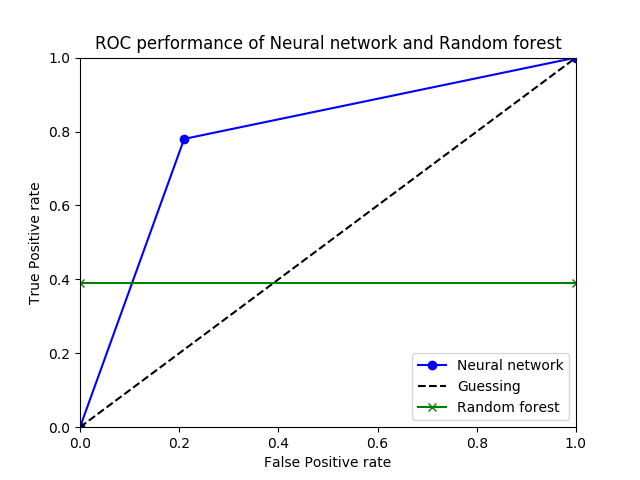
If these researchers had provided simultaneous values of TP rate and FP rate, we could draw a nice curve in ROC space, but they’ve given us only enough to draw a single point for the neural network, shown in blue.
Again, all we have for the Random Forest is a single True Positive rate value (0.39) but not the accompanying False Positive rate. This isn’t enough; by simply classifying everything as Large Loss, we could get a Large-Loss accuracy of 1.00. We need the other coordinate.
On the ROC graph, I’ve shown RF performance by the green line at y=0.39. The RF performance is a single point somewhere on that line. If its False Positive rate is less than about 0.10, Random Forest is actually better than the neural network. So we can’t even answer which model is better.
Let’s ask another question: Is their deep learning solution usable?
Bottom line: No, these results are probably not good enough for the insurance company.
Here is the reasoning. In order to judge how well the Neural network is doing, we really need to know the costs of the errors. They aren’t provided. This is not uncommon: these numbers would have to be provided by the client (the insurance company), and in my experience most clients can’t assign exact costs to the errors. So we need some other way of understanding the performance. There are several ways to do this.
One way is to answer the question: How many false positives must I deal with for each true positive I get? To calculate this, recall that their population of drivers has a 99:1 skew of Non-Large Loss to Large Loss. So they have a 99/1 proportion of negatives to positives. Their performance on false positives to true positives is 0.22/0.78. We can answer the original question by multiplying these together:
99/1 x 0.22/0.78 ~= 28
This result means that, using their Neural network, they must process 28 uninteresting Non-Large Loss customers (false alarms) for each Large-Loss customer they want. And they may only find 78% of the Large-Loss customers anyway.
Another way to understand their performance is to convert it to precision. Given 29 alarms, only 1 will be positive, so the precision is 1/28 or about 4%.
Is this acceptable to the insurance company? I’m not an expert, but I would guess not. 4% precision is low, and 28 false alarms per real alarm is a high cost to tolerate. Unless the company has devoted a large workforce to this task, they probably can’t afford it.
Could these researchers do better? I think so. Since the results didn’t take into account the class imbalance, I assume the loss function and training regimen weren’t appropriate for the problem, either. Learning on imbalanced data isn’t a trivial undertaking, but any effort in that direction would likely yield better results.
Evaluating the Solution as a Project
Stepping back from the technical details, we can critique this as a solution to a business problem. The “case” they’ve given us here doesn’t say anything really about what business problem they’re trying to solve. We can’t judge whether the solution is appropriate for solving it. The write-up simply states, “it’s important for adjusters to understand which clients are at higher risk for such cases in order to optimize the pricing of its policies“.
Ignoring their model’s poor performance, is this even a good approach? “Understanding” often includes understanding the predictors, not just the names and account numbers of the high-scoring drivers. Nothing is said about how this understanding is achieved. Though neural networks are extremely popular right now, deep learned neural networks are notorious for not being comprehensible. They may not have been the ideal choice for this problem.
Finally, nothing is said about how the solution would affect pricing, nor even what is important from the modeling to optimize pricing.
An important part about solving applications with machine learning is understanding how the model is going to be used in the context of the application (the larger process). This project simply showed a quick translation of a business problem into a two-class problem, then showed the technical details of the model and the results attained. Because the initial analysis of the insurance problem was superficial, we don’t even know what performance would be acceptable.
Conclusion
I’ve been pretty merciless in critiquing this project simply because it illustrates a lot of mistakes data scientists make when they work on business problems. In other words, it was convenient, though hardly unique. In case you think only amateurs or beginners make these kinds of mistakes, here is the source of the case study. Note that it was one of Google’s “customer success stories” presented in promotion of the Google Cloud Platform.
From what I’ve seen, it’s rare for a machine learning or data science curriculum to cover the application issues I’ve mentioned here. Most courses concentrate on teaching algorithms, so they tend to simplify the data and evaluation complexities that come up in real-world applications. It took me many years of experience to understand these subtleties and know which problems to anticipate.
How about you? What was the biggest surprise you found going from academic projects to real-world applications? What would you do differently? What do you wish you had learned in school? Comment below to start a discussion.
Bio: Tom Fawcett is co-author of the popular book Data Science for Business, and brings over 20 years of experience applying machine learning and data mining in practical applications. He is a veteran of companies such as Verizon and HP Labs, and an editor of the Machine Learning Journal.
Original. Reposted with permission.
Related: