 A Beginner’s Guide to the Data Science Pipeline
 A Beginner’s Guide to the Data Science Pipeline
On one end was a pipe with an entrance and at the other end an exit. The pipe was also labeled with five distinct letters: "O.S.E.M.N."
By Randy Lao, Machine Learning Teaching Assistant

“Believe it or not, you are no different than Data. Put yourself into Data’s shoes and you’ll see why.”
Once upon a time there was a boy named Data. Throughout his life, he was always trying to understand what his purpose was. What values do I have? What impact can I make on this world? Where does Data come from? See any similarities between you and Data? These questions were always in his mind and fortunately, through sheer luck, Data finally came across a solution and went through a great transformation.
It all started as Data was walking down the rows when he came across a weird, yet interesting, pipe. On one end was a pipe with an entrance and at the other end an exit. The pipe was also labeled with five distinct letters: “O.S.E.M.N.”. Curious as he was, Data decided to enter the pipeline. Long story short… in came data and out came insight.

Reminder: This article will cover briefly a high-level overview of what to expect in a typical data science pipeline. From framing your business problem to creating actionable insights. Don’t worry this will be an easy read!
Data Science is OSEMN
You’re awesome. I’m awesome. Data Science is OSEMN. Why is data science “awesome” you may ask? Well, as the aspiring data scientist you are, you’re given the opportunity to hone your powers of both a wizard and a detective. By wizard, I mean having the powers to predict things automagically! And by detective, it’s having the ability to find unknown patterns and trends in your data!

Understanding the typical work flow on how the data science pipeline works is a crucial step towards business understanding and problem solving. If you are intimidated about how the data science pipeline works, say no more. This article is for you! I found a very simple acronym from Hilary Mason and Chris Wiggins that you can use throughout your data science pipeline. That is O.S.E.M.N.
OSEMN Pipeline
- O — Obtaining our data
- S — Scrubbing / Cleaning our data
- E — Exploring / Visualizing our data will allow us to find patterns and trends
- M — Modeling our data will give us our predictive power as a wizard
- N — Interpreting our data
Business Question
So before we even begin the OSEMN pipeline, the most crucial and important step that we must take into consideration is understanding what problemwe’re trying to solve. Let’s say this again. Before we even begin doing anything with “Data Science”, we must first take into consideration what problem we’re trying to solve. If you have a small problem you want to solve, then at most you’ll get a small solution. If you have a BIG problem to solve, then you’ll have the possibility of a BIG solution.
Ask yourself:
- How can we translate data into dollars?
- What impact do I want to make with this data?
- What business value does our model bring to the table?
- What will save us lots of money?
- What can be done to make our business run more efficiently?
“Show me the money!”

Knowing this fundamental concept will bring you far and lead you to greater steps in being successful towards being a “Data Scientist” (from what I believe… sorry I’m not one!) But nonetheless, this is still a very important step you must do! No matter how well your model predicts, no matter how much data you acquire, and no matter how OSEMN your pipeline is… your solution or actionable insight will only be as good as the problem you set for yourself.
“Good data science is more about the questions you pose of the data rather than data munging and analysis” — Riley Newman
Obtain Your Data
You cannot do anything as a data scientist without even having any data. As a rule of thumb, there are some things you must take into consideration when obtaining your data. You must identify all of your available datasets (which can be from the internet or external/internal databases). You must extract the data into a usable format (.csv, json, xml, etc..)
Skills Required:
- Database Management: MySQL, PostgresSQL,MongoDB
- Querying Relational Databases
- Retrieving Unstructured Data: text, videos, audio files, documents
- Distributed Storage: Hadoops, Apache Spark/Flink
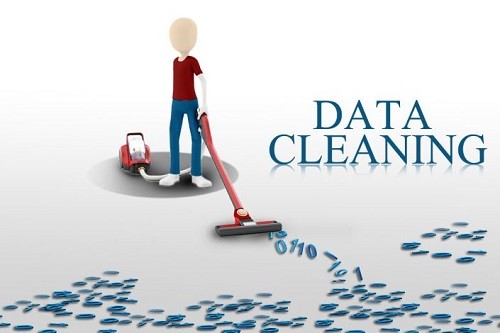
Scrubbing / Cleaning Your Data
Clean up on column 5! This phase of the pipeline should require the most time and effort. Because the results and output of your machine learning model is only as good as what you put into it. Basically, garbage in garbage out.
Objective:
- Examine the data: understand every feature you’re working with, identify errors, missing values, and corrupt records
- Clean the data: throw away, replace, and/or fill missing values/errors
Skills Required:
- Scripting language: Python, R, SAS
- Data Wrangling Tools: Python Pandas, R
- Distributed Processing: Hadoop, Map Reduce / Spark
“The man who is prepared has his battle half fought” — Miguel de Cervantes
Exploring (Exploratory Data Analysis)
Now during the exploration phase, we try to understand what patterns and values our data has. We’ll be using different types of visualizations and statistical testings to back up our findings. This is where we will be able to derive hidden meanings behind our data through various graphs and analysis. Go out and explore!
“A ship in harbor is safe — but that is not what ships are built for.” — John A. Shedd.

Objective:
- Find patterns in your data through visualizations and charts
- Extract features by using statistics to identify and test significant variables
Skills Required:
- Python: Numpy, Matplotlib, Pandas, Scipy
- R: GGplot2, Dplyr
- Inferential statistics
- Experimental Design
- Data Visualization
Tip: Have your “spidey senses” tingling when doing analysis. Have the sense to spot weird patterns or trends. Always be on the lookout for an interesting findings!
Design consideration: Most of the time people just go straight to the visual “lets get it done”. It’s all about the end user who will be interpreting it. Focus on your audience.
Modeling (Machine Learning)
Now comes the fun part. Models are general rules in a statistical sense.Think of a machine learning model as tools in your toolbox. You will have access to many algorithms and use them to accomplish different business goals. The better features you use the better your predictive power will be. After cleaning your data and finding what features are most important, using your model as a predictive tool will only enhance your business decision making.
Predictive Analytics is emerging as a game-changer. Instead of looking backward to analyze “what happened?” Predictive analytics help executives answer “What’s next?” and “What should we do about it?” (Forbes Magazine, April 1, 2010)

Predictive Power Example: One great example can be seen in Walmart’s supply chain. Walmart was able to predict that they would sell out all of their Strawberry Pop-tarts during the hurricane season in one of their store location. Through data mining, their historical data showed that the most popular item sold before the event of a hurricane was Pop-tarts. As crazy it sounds, this is a true story and brings up the point on not to underestimate the power of predictive analytics.
Objective:
- In-depth Analytics: create predictive models/algorithms
- Evaluate and refine the model
Skills Required:
- Machine Learning: Supervised/Unsupervised algorithms
- Evaluation methods
- Machine Learning Libraries: Python (Sci-kit Learn) / R (CARET)
- Linear algebra & Multivariate Calculus
“Models are opinions embedded in mathematics” — Cathy O’Neil
Interpreting (Data Storytelling)
It’s story time! The most important step in the pipeline is to understand and learn how to explain your findings through communication. Telling the story is key, don’t underestimate it. It’s about connecting with people, persuading them, and helping them. The art of understanding your audience and connecting with them is one of the best part of data storytelling.
“I believe in the power of storytelling. Stories open our hearts to a new place, which opens our minds, which often leads to action” — Melinda Gates
Emotion plays a big role in data storytelling. People aren’t going to magically understand your findings. The best way to make an impact is telling your story through emotion. We as humans are naturally influenced by emotions. If you can tap into your audiences’ emotions, then you my friend, are in control. When you’re presenting your data, keep in mind the power of psychology. The art of understanding your audience and connecting with them is one of the best part of data storytelling.
Best Practice: A good practice that I would highly suggest to enhance your data storytelling is to rehearse it over and over. If you’re a parent then good news for you.Instead of reading the typical Dr. Seuss books to your kids before bed, try putting them to sleep with your data analysis findings! Because if a kid understands your explanation, then so can anybody, especially your Boss!

“If you can’t explain it to a six year old, you don’t understand it yourself.” — Albert Einstein
Objective:
- Identify business insights: return back to business problem
- Visualize your findings accordingly: keep it simple and priority driven
- Tell a clear and actionable story: effectively communicate to non-technical audience
Skills Required:
- Business Domain Knowledge
- Data Visualization Tools: Tablaeu, D3.JS, Matplotlib, GGplot, Seaborn
- Communication: Presenting/Speaking & Reporting/Writing
Updating Your Model
Don’t worry your story doesn’t end here. As your model is in production, its important to update your model periodically, depending on how often you receive new data. The more data you receive the more frequent the update. Lets say you’re Amazon and you introduced a new feature for customers to buy “footwear feature”. You’re old model doesn’t have this and now you must update the model that includes this feature. If not, your model will degrade over time and won’t perform as good, leaving your business to degrade as well. The introduction to new features will alter the model performance either through different variations or possibly correlations to other features.
Conclusion
In Summary,
- Form your Business Problem
- Obtain your data
obtain your data, clean your data, explore your data with visualizations, model your data with different machine learning algorithms, interpret your data by evaluation, and update your model.
Remember, we’re no different than Data. We both have values, a purpose, and a reason to exist in this world.
Most of the problems you will face are, in fact, engineering problems. Even with all the resources of a great machine learning god, most of the impact will come from great features, not great machine learning algorithms. So, the basic approach is:
- Make sure your pipeline is solid end to end
- Start with a reasonable objective
- Understand your data intuitively
- Make sure that your pipeline stays solid
This approach will hopefully make lots of money and/or make lots of people happy for a long period of time.
So… the next time someone asks you what is data science. Tell them:
“Data Science is OSEMN”
I hope you guys learned something today! If there is anything that you guys would like to add to this article, feel free to leave a message and don’t hesitate! Any sort of feedback is truly appreciated. Don’t be afraid to share this! Thanks!
Connect with me on LinkedIn:
https://www.linkedin.com/in/randylaosat
Bio: Randy Lao is a Machine Learning Teaching Assistant. If opportunity doesn't knock, build a door!
Original. Reposted with permission.
Related:
- Managing Machine Learning Workflows with Scikit-learn Pipelines Part 1: A Gentle Introduction
- Data Science at the Command Line: Exploring Data
- Getting Started with Machine Learning in One Hour!