Learning from Imbalanced Classes
Imbalanced classes can cause trouble for classification. Not all hope is lost, however. Check out this article for methods in which to deal with such a situation.
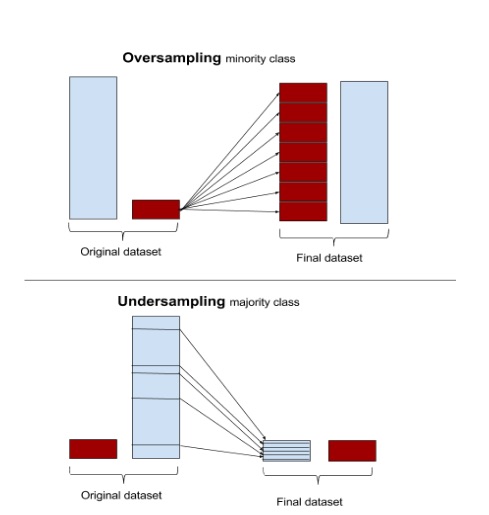
Oversampling and undersampling
The easiest approaches require little change to the processing steps, and simply involve adjusting the example sets until they are balanced. Oversampling randomly replicates minority instances to increase their population. Undersampling randomly downsamples the majority class. Some data scientists (naively) think that oversampling is superior because it results in more data, whereas undersampling throws away data. But keep in mind that replicating data is not without consequence—since it results in duplicate data, it makes variables appear to have lower variance than they do. The positive consequence is that it duplicates the number of errors: if a classifier makes a false negative error on the original minority data set, and that data set is replicated five times, the classifier will make six errors on the new set. Conversely, undersampling can make the independent variables look like they have a higher variance than they do.
Because of all this, the machine learning literature shows mixed results with oversampling, undersampling, and using the natural distributions.
Most machine learning packages can perform simple sampling adjustment. The R packageunbalanced implements a number of sampling techniques specific to imbalanced datasets, and scikit-learn.cross_validation has basic sampling algorithms.
Bayesian argument of Wallace et al.
Possibly the best theoretical argument of—and practical advice for—class imbalance was put forth in the paper Class Imbalance, Redux, by Wallace, Small, Brodley and Trikalinos4. They argue for undersampling the majority class. Their argument is mathematical and thorough, but here I’ll only present an example they use to make their point.
They argue that two classes must be distinguishable in the tail of some distribution of some explanatory variable. Assume you have two classes with a single dependent variable, x. Each class is generated by a Gaussian with a standard deviation of 1. The mean of class 1 is 1 and the mean of class 2 is 2. We shall arbitrarily call class 2 the majority class. They look like this:
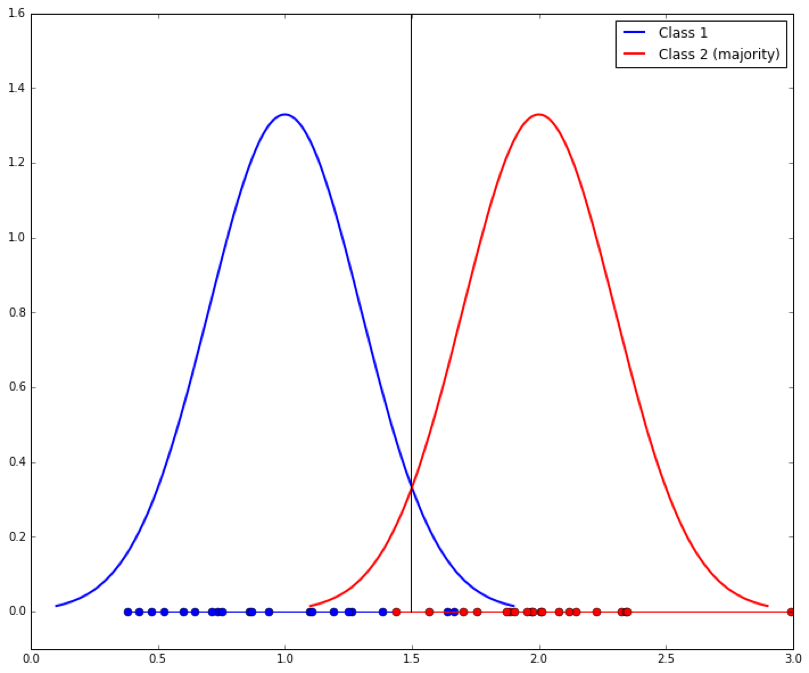
Given an x value, what threshold would you use to determine which class it came from? It should be clear that the best separation line between the two is at their midpoint, x=1.5, shown as the vertical line: if a new example x falls under 1.5 it is probably Class 1, else it is Class 2. When learning from examples, we would hope that a discrimination cutoff at 1.5 is what we would get, and if the classes are evenly balanced this is approximately what we should get. The dots on the x axis show the samples generated from each distribution.
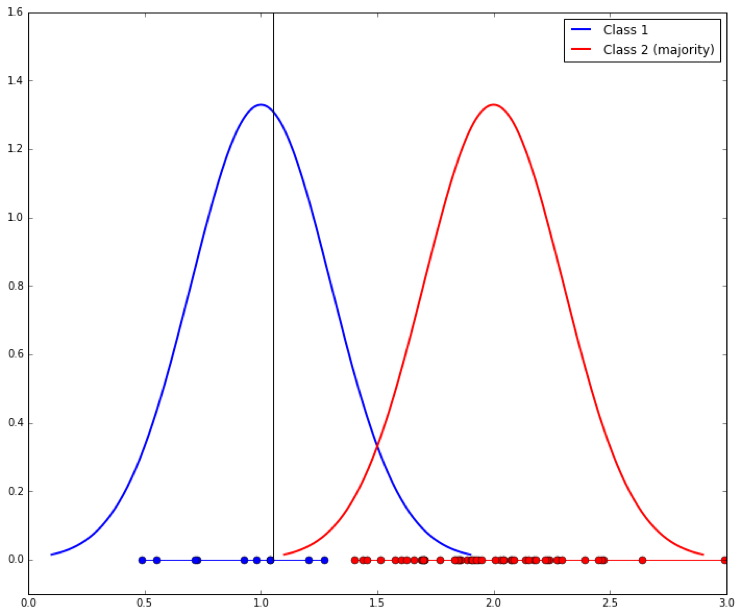
But we’ve said that Class 1 is the minority class, so assume that we have 10 samples from it and 50 samples from Class 2. It is likely we will learn a shifted separation line, like this:
We can do better by down-sampling the majority class to match that of the minority class. The problem is that the separating lines we learn will have high variability (because the samples are smaller), as shown here (ten samples are shown, resulting in ten vertical lines):
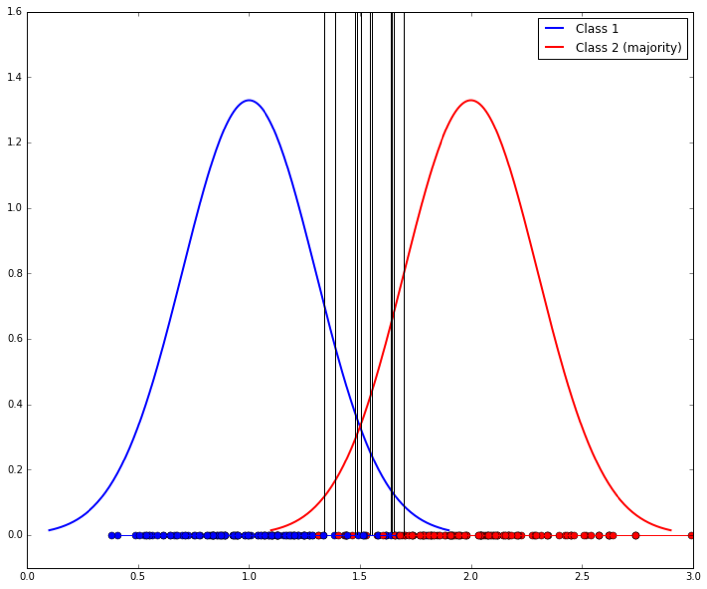
So a final step is to use bagging to combine these classifiers. The entire process looks like this:
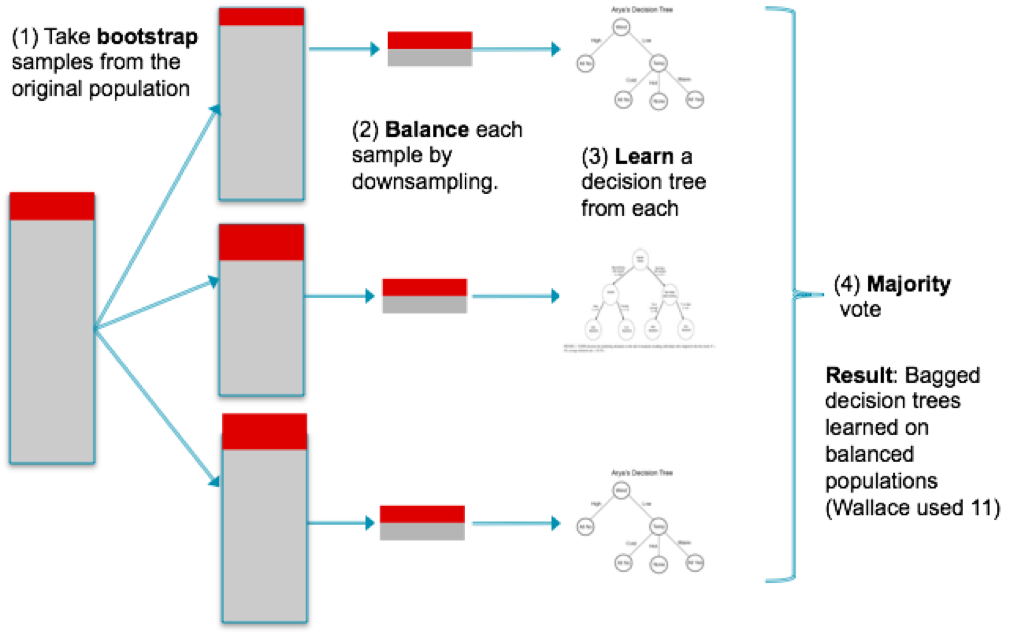
This technique has not been implemented in Scikit-learn, though a file called blagging.py(balanced bagging) is available that implements a BlaggingClassifier, which balances bootstrapped samples prior to aggregation.
Neighbor-based approaches
Over- and undersampling selects examples randomly to adjust their proportions. Other approaches examine the instance space carefully and decide what to do based on their neighborhoods.
For example, Tomek links are pairs of instances of opposite classes who are their own nearest neighbors. In other words, they are pairs of opposing instances that are very close together.
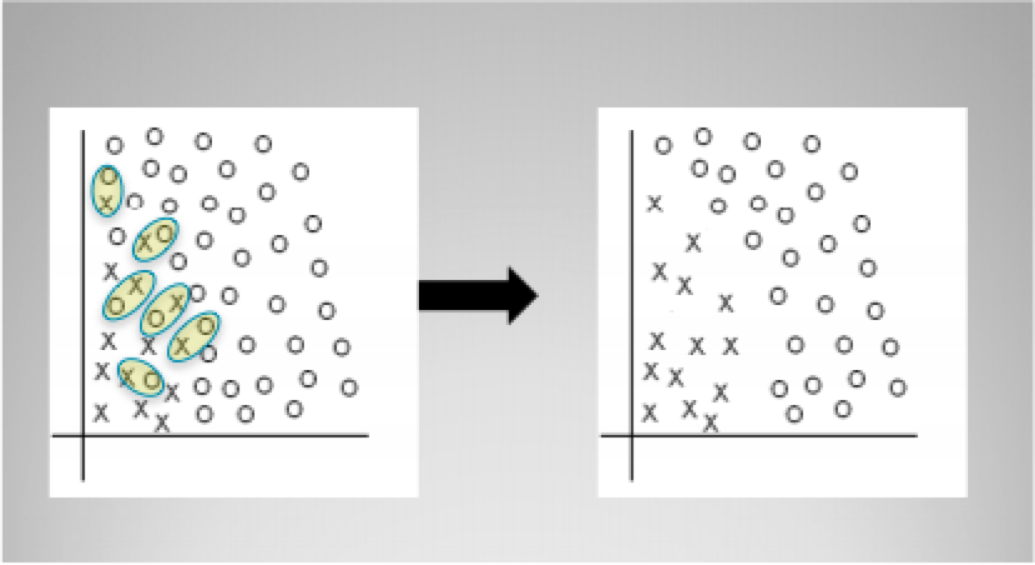
Tomek’s algorithm looks for such pairs and removes the majority instance of the pair. The idea is to clarify the border between the minority and majority classes, making the minority region(s) more distinct. The diagram above shows a simple example of Tomek link removal. The R package unbalanced implements Tomek link removal, as does a number of sampling techniques specific to imbalanced datasets. Scikit-learn has no built-in modules for doing this, though there are some independent packages (e.g., TomekLink).
Synthesizing new examples: SMOTE and descendants
Another direction of research has involved not resampling of examples, but synthesis of new ones. The best known example of this approach is Chawla’s SMOTE (Synthetic Minority Oversampling TEchnique) system. The idea is to create new minority examples by interpolating between existing ones. The process is basically as follows. Assume we have a set of majority and minority examples, as before:
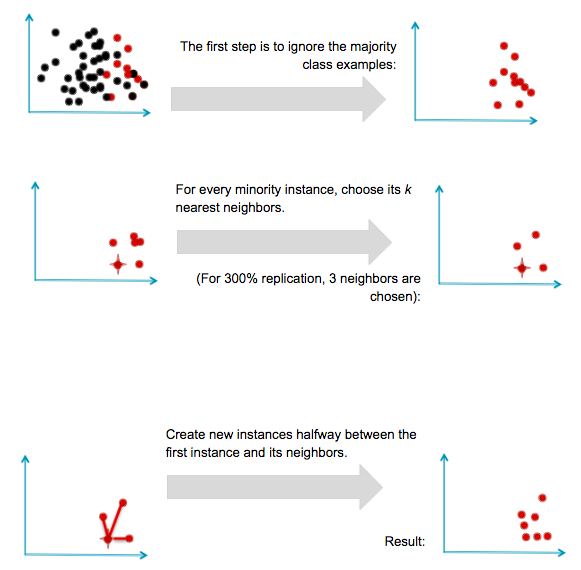
SMOTE was generally successful and led to many variants, extensions, and adaptations to different concept learning algorithms. SMOTE and variants are available in R in theunbalanced package and in Python in the UnbalancedDataset package.
It is important to note a substantial limitation of SMOTE. Because it operates by interpolating between rare examples, it can only generate examples within the body of available examples—never outside. Formally, SMOTE can only fill in the convex hull of existing minority examples, but not create new exterior regions of minority examples.
Adjusting class weights
Many machine learning toolkits have ways to adjust the “importance” of classes. Scikit-learn, for example, has many classifiers that take an optional class_weight parameter that can be set higher than one. Here is an example, taken straight from the scikit-learn documentation, showing the effect of increasing the minority class’s weight by ten. The solid black line shows the separating border when using the default settings (both classes weighed equally), and the dashed line after the class_weight parameter for the minority (red) classes changed to ten.
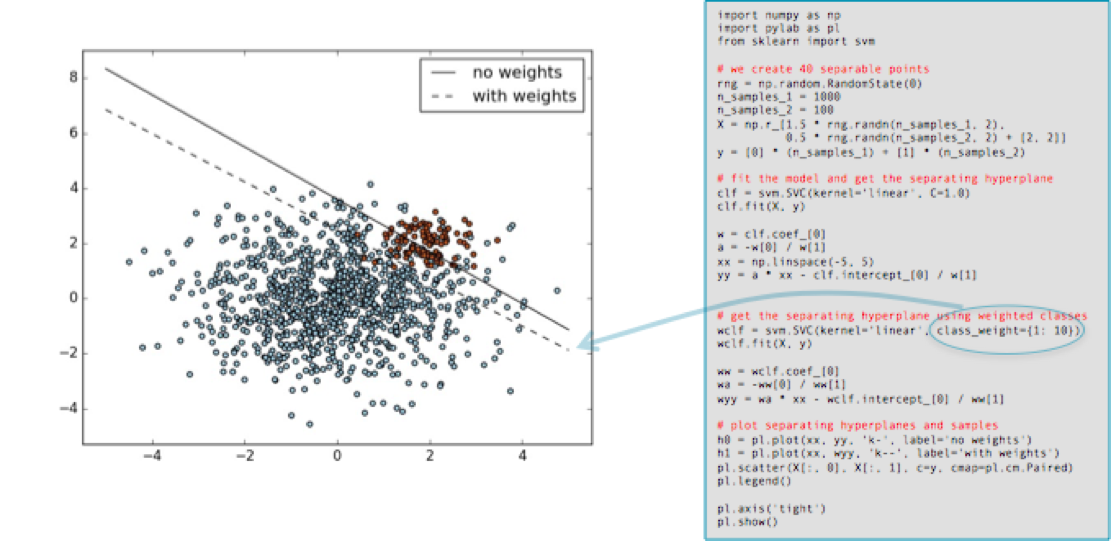
As you can see, the minority class gains in importance (its errors are considered more costly than those of the other class) and the separating hyperplane is adjusted to reduce the loss.
It should be noted that adjusting class importance usually only has an effect on the cost of class errors (False Negatives, if the minority class is positive). It will adjust a separating surface to decrease these accordingly. Of course, if the classifier makes no errors on the training set errors then no adjustment may occur, so altering class weights may have no effect.
And beyond
This post has concentrated on relatively simple, accessible ways to learn classifiers from imbalanced data. Most of them involve adjusting data before or after applying standard learning algorithms. It’s worth briefly mentioning some other approaches.
New algorithms
Learning from imbalanced classes continues to be an ongoing area of research in machine learning with new algorithms introduced every year. Before concluding I’ll mention a few recent algorithmic advances that are promising.
In 2014 Goh and Rudin published a paper Box Drawings for Learning with Imbalanced Data5which introduced two algorithms for learning from data with skewed examples. These algorithms attempt to construct “boxes” (actually axis-parallel hyper-rectangles) around clusters of minority class examples:
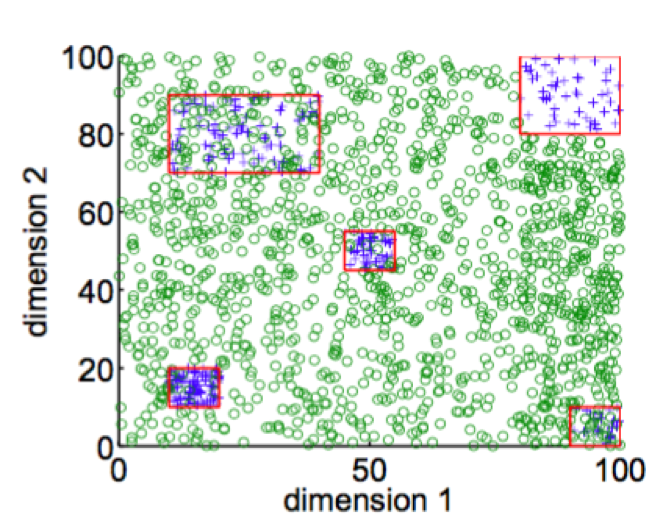
Their goal is to develop a concise, intelligible representation of the minority class. Their equations penalize the number of boxes and the penalties serve as a form of regularization.
They introduce two algorithms, one of which (Exact Boxes) uses mixed-integer programming to provide an exact but fairly expensive solution; the other (Fast Boxes) uses a faster clustering method to generate the initial boxes, which are subsequently refined. Experimental results show that both algorithms perform very well among a large set of test datasets.
Earlier I mentioned that one approach to solving the imbalance problem is to discard the minority examples and treat it as a single-class (or anomaly detection) problem. One recent anomaly detection technique has worked surprisingly well for just that purpose. Liu, Ting and Zhou introduced a technique called Isolation Forests6 that attempted to identify anomalies in data by learning random forests and then measuring the average number of decision splits required to isolate each particular data point. The resulting number can be used to calculate each data point’s anomaly score, which can also be interpreted as the likelihood that the example belongs to the minority class. Indeed, the authors tested their system using highly imbalanced data and reported very good results. A follow-up paper by Bandaragoda, Ting, Albrecht, Liu and Wells7 introduced Nearest Neighbor Ensembles as a similar idea that was able to overcome several shortcomings of Isolation Forests.
Buying or creating more data
As a final note, this blog post has focused on situations of imbalanced classes under the tacit assumption that you’ve been given imbalanced data and you just have to tackle the imbalance. In some cases, as in a Kaggle competition, you’re given a fixed set of data and you can’t ask for more.
But you may face a related, harder problem: you simply don’t have enough examples of the rare class. None of the techniques above are likely to work. What do you do?
In some real world domains you may be able to buy or construct examples of the rare class. This is an area of ongoing research in machine learning. If rare data simply needs to be labeled reliably by people, a common approach is to crowdsource it via a service like Mechanical Turk. Reliability of human labels may be an issue, but work has been done in machine learning to combine human labels to optimize reliability. Finally, Claudia Perlich in her Strata talk All The Data and Still Not Enough gives examples of how problems with rare or non-existent data can be finessed by using surrogate variables or problems, essentially using proxies and latent variables to make seemingly impossible problems possible. Related to this is the strategy of using transfer learning to learn one problem and transfer the results to another problem with rare examples, as described here.
Comments or questions?
Here, I have attempted to distill most of my practical knowledge into a single post. I know it was a lot, and I would value your feedback. Did I miss anything important? Any comments or questions on this blog post are welcome.
Resources and further reading
- Several Jupyter notebooks are available illustrating aspects of imbalanced learning.
- A notebook illustrating sampled Gaussians, above, is at
Gaussians.ipynb. - A simple implementation of Wallace’s method is available at
blagging.py. It is a simple fork of the existing bagging implementation of sklearn, specifically./sklearn/ensemble/bagging.py. - A notebook using this method is available at
ImbalancedClasses.ipynb. It loads up several domains and compares blagging with other methods under different distributions.
- A notebook illustrating sampled Gaussians, above, is at
- Source code for Box Drawings in MATLAB is available from:http://web.mit.edu/rudin/www/code/BoxDrawingsCode.zip
- Source code for Isolation Forests in R is available at:https://sourceforge.net/projects/iforest/
Thanks to Chloe Mawer for her Jupyter Notebook design work.
[1] Natalie Hockham makes this point in her talk Machine learning with imbalanced data sets, which focuses on imbalance in the context of credit card fraud detection.
[2] By definition there are fewer instances of the rare class, but the problem comes about because the cost of missing them (a false negative) is much higher.
[3] The details in courier are specific to Python’s Scikit-learn.
[4] “Class Imbalance, Redux”. Wallace, Small, Brodley and Trikalinos. IEEE Conf on Data Mining. 2011.
[5] Box Drawings for Learning with Imbalanced Data.” Siong Thye Goh and Cynthia Rudin. KDD-2014, August 24–27, 2014, New York, NY, USA.
[6] “Isolation-Based Anomaly Detection”. Liu, Ting and Zhou. ACM Transactions on Knowledge Discovery from Data, Vol. 6, No. 1. 2012.
[7] “Efficient Anomaly Detection by Isolation Using Nearest Neighbour Ensemble.” Bandaragoda, Ting, Albrecht, Liu and Wells. ICDM-2014
Bio: Tom Fawcett is the co-author of the popular book Data Science for Business. Tom brings over 20 years of experience applying machine learning and data mining in practical applications. He is a veteran of companies such as Verizon and HP Labs, and an editor of the Machine Learning Journal.
Original. Reposted with permission.
Related:
- Do You Need Big Data or Smart Data? Part 1
- The Fallacy of Seeing Patterns
- Predictive Analytics Introductory Key Terms, Explained