How Bayesian Networks Are Superior in Understanding Effects of Variables
Bayes Nets have remarkable properties that make them better than many traditional methods in determining variables’ effects. This article explains the principle advantages.
By Steven M. Struhl, ConvergeAnalytic.
Bayes Nets (or Bayesian Networks) give remarkable results in determining the effects of many variables on an outcome. They typically perform strongly even in cases when other methods falter or fail. These networks have had relatively little use with business-related problems, although they have worked successfully for years in fields such as scientific research, public safety, aircraft guidance systems and national defense. Bayes Nets fully warrant wider use.
Importantly, they often outperform regression, particularly in determining variables’ effects. Regression is one of the most august multivariate methods, and among the most studied and applied. However, it has some properties that make it less than ideal for determining the strengths of variables in influencing outcomes. Let’s go over a small example and then talk about some properties of networks that lead to their typically strong performance.
A small example: Bayes Nets vs. regression
We compared Bayes Nets to regression in a study that measured reaction speed to specific words and purchase interest. That is, people were shown words on a computer that were supposed to be associated with different products. They were asked to click if they agreed the word applied.
The idea was that clicking more quickly meant they found a closer association between the word and the brand. A quicker response got a higher score, and no answer got a zero. Scores ranged up to about 650, while the target variable, purchase intent, ranged from 1 to 5.
The questions this tried to answer: whether there was any systematic relationship, and if so, which words had the strongest associations. Regular (OLS) regression did not do well with this. Only four of the eleven measured variables entered the model, and the explained variance was only 30.4%.
Regression might not have been working well due to the target ranging only from 1 to 5—regression expects that all variables can take an infinite number of values. Therefore, we also tried variants of the linear modeling family designed for target variables having just a few values, discriminant analysis and multinomial logit. Results were similarly poor.
Bayes Nets, however, found relationships for all variables, with a clear hierarchy of strengths, and 84.1% correct prediction. The question that arises, then, is what made Bayes Nets so much better at finding effects?
How Bayes Nets work
As the term network implies, connections form between the variables based on how they most closely align across their distributions (or patterns of values). Variables closest to each other have the strongest similarities in these patterns.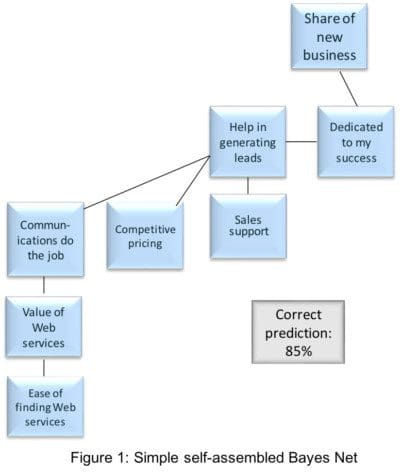
Variables being in a network also means that they all influence one another—a change in one affects all other variables. Variables closest to each other have the most influence on each other. This pattern of effects has been compared to ripples moving from a disturbance in a pond. Movements are largest at points closest to whatever caused the ripples, and there is some movement—even if slight—at all points.
Networks can be self-assembling, finding the best pattern of connections to explain (or predict) the target variable. They learn the structures of the data, looking for the strongest connections. In the word-association analysis, we made a target-centered net, so that all variables connected with the target (purchase intent), but otherwise they connected to each other based solely on patterns in the data.
In Figure 1, we have another small self-assembled network, where the target variable is share of new business. The connections are sensible and the prediction level very strong.
Bayes Nets’ ability to include effects from all variables differs sharply from the rules of regression. Regression assumes that when one variable changes, all other variables remain the same.
If we are doing an experiment, where all the variables are set up so that they vary in completely independent ways, regression’s assumption works perfectly well. However, in the real world, variables have many subtle interrelationships. Regression does not capture these.
This accounts for the failures of many exquisite regression models when they encounter reality, and underlies the stark difference between two broad classes of analysis: experimental research and policy-based research. Policy must live in the messiness of the real world.
Bayes Nets include all variables when estimating any one variable’s effects. This, in short, gives you a more realistic shot at seeing what happens when changes are introduced into a complex system.

Whole distribution approach
The network puts together variables by examining the whole distributions of all the variables, finding how they best align across all their values. This again differs from regression. Even in the most elaborate regression-based models, what underlies is a correlation matrix. A correlation is a one-number summary of how well the two variables fall into a straight-line pattern.
Looking at the whole distribution of values and how they align gives Bayes Nets a more detailed look at how variables fit together. While nearly everybody knows what a correlation statistic looks like, showing how this compares with a distribution underlines how much extra information the Bayes Net uses. This contrast appears in figure 2.
Bayes Nets are not forced to shrink coefficients like regression
Regression is additive, meaning it envisions the target variable as the sum of the predictor variables (with each predictor multiplied by some coefficient). These coefficients typically are taken as importances, with a larger coefficient meaning the variable is more important. You can think of regression as analogous to a recipe, like the recipe for a cake. The cake equals the sum of the ingredients, each in a certain amount. As you add more ingredients, each one accounts for a smaller proportion of the total.
Regression first finds the variable that explains the most variance (or pattern) in the target variable, then adds others to explain as much variance as possible. It is not unusual to find the first variable in a regression having a steadily declining coefficient as more variables are added.
You can find a first variable having a coefficient of, say, 0.6 by itself—and a coefficient of 0.1 when 20 other variables are included. Yet the coefficient of 0.6 means the underlying relationship between this predictor and the target variable is 0.6 units of change in the target for each unit of change in this predictor. How can this basic relationship be 0.6 to 1, and then somehow become so different?
Here is the answer: regression is a method designed to get the best possible point estimate of the predictor, and it will use all the variables it can to do so. Regression also has one broad underlying assumption that many forget: that the model is correct. This means that you have all the right ingredients, with nothing extra added and nothing important excluded. A regression will make its best estimates with whatever you throw at it.
Going back to our metaphoric cake, this means that if you wrongly put gravel into the recipe, the proportions of all other ingredients will shrink. If you mistakenly omit an essential ingredient such as sugar, the proportions of all other ingredients will expand. The cake won’t be any good, and we will know it at once. When dealing with more abstract problems, such as attempting to explain what influences behavior, we are not so lucky.
Because Bayes Nets look at interdependencies—patterns of connections and effects—they are not so adversely affected by adding extra variables. Those with the strongest effects, based on their distributions, still have those effects when other variables are added. More technically, networks do not have much problem with over-parameterization.
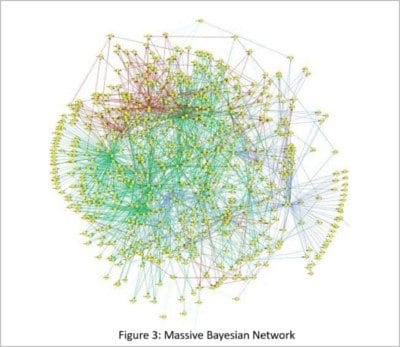
Figure 3 shows how a network can analyze data sets with many more variables than can a regression. This is a massive network, which diagnoses the causes of B cell chronic lymphocytic leukemia (B-CLL). It has well over 2,000 variables (each spot is one variable). And it works.
Networks also can deal with vast swaths of missing data. Typically, with regression, you must plug the missing spots artificially or lose an entire case (or observation) due to one missing value in a many-variable model. Because networks are based on how variables align with each other (as we saw in Figure 2), they will use any information that is available.
Many other network advantages, but time is short
Networks have many other remarkable properties that make them true powerhouses in understanding variables’ effects, but we do not have space for them here. First, they make use of conditional probability. This allows them to outthink us in many applications. That, however, will be a topic for next time.
References
Regression
Lorenz, F O (1987) Teaching about influence in simple regression. Teaching Sociology, 15, 173-177.
Mauro, R. (1990) Understanding l.o.v.e. (left out variables error): A method for estimating the effects of omitted variables. Psychological Bulletin, 108, 314-329.
Mosteller, F., Tukey, J., (1977) Data Analysis and Regression: A Second Course in Statistics, Pearson, Upper Saddle River, NJ.
Wilkinson, L., Blank, G, Gruber, C. (1995) Desktop Data Analysis with Systat, SPSS, Inc., Chicago, IL.
Bayes Nets
Cooper, G F, Herskovits, E, (1992) A Bayesian method for the induction of probabilistic networks from data, Machine Learning, 9 pp 309-347
Pearl, J (1988) Probabilistic Reasoning in Intelligent Systems: Networks of Plausible Inference Representation and Reasoning Series (2nd ed.), Morgan Kaufmann, San Francisco, CA
Struhl, S (2017), Artificial Intelligence Marketing and Predicting Consumer Choice, Kogan Page, London
Witten, I, Frank E (2005) Data Mining: Practical Machine Learning Tools and Techniques (2nd Ed), Morgan Kaufmann, San Francisco
Yudkowsky, E (2016) An intuitive Explanation of Bayes’ Theorem, http://yudkowskynet/rational/bayes [Last accessed 8.15.17]
Bio: Dr. Steven Struhl is the author of Artificial Intelligence Marketing and Predicting Consumer Choice (2017, Kogan Page), Practical Text Analytics (2015, Kogan Page) and Market Segmentation (1992, American Marketing Association; revised 2013).
He is founder and principal at Converge Analytic, specializing in advanced analytics and marketing sciences. He has over 30 years’ experience with a wide range of industries, as well as with governmental and non-profit agencies.
Related: