A Beginner’s Guide to Data Engineering – Part II
In this post, I share more technical details on how to build good data pipelines and highlight ETL best practices. Primarily, I will use Python, Airflow, and SQL for our discussion.
By Robert Chang, Airbnb.

Image Credit: A transformed modern warehouse at Hangar 16, Madrid (Cortesía de Iñaqui Carnicero Arquitectura)
Recapitulation
In A Beginner’s Guide to Data Engineering — Part I, I explained that an organization’s analytics capability is built layers upon layers. From collecting raw data and building data warehouses to applying Machine Learning, we saw why data engineering plays a critical role in all of these areas.
One of any data engineer’s most highly sought-after skills is the ability to design, build, and maintain data warehouses. I defined what data warehousing is and discussed its three common building blocks — Extract, Transform, and Load, where the name ETL comes from.
For those who are new to ETL processes, I introduced a few popular open source frameworks built by companies like LinkedIn, Pinterest, Spotify, and highlight Airbnb’s own open-sourced tool Airflow. Finally, I argued that data scientist can learn data engineering much more effectively with the SQL-based ETL paradigm.
Part II Overview
The discussion in part I was somewhat high level. In Part II (this post), I will share more technical details on how to build good data pipelines and highlight ETL best practices. Primarily, I will use Python, Airflow, and SQL for our discussion.
First, I will introduce the concept of Data Modeling, a design process where one carefully defines table schemas and data relations to capture business metrics and dimensions. We will learn Data Partitioning, a practice that enables more efficient querying and data backfilling. After this section, readers will understand the basics of data warehouse and pipeline design.
In later sections, I will dissect the anatomy of an Airflow job. Readers will learn how to use sensors, operators, and transfers to operationalize the concepts of extraction, transformation, and loading. We will highlight ETL best practices, drawing from real life examples such as Airbnb, Stitch Fix, Zymergen, and more.
By the end of this post, readers will appreciate the versatility of Airflow and the concept of configuration as code. We will see, in fact, that Airflow has many of these best practices already built in.
Data Modeling

Image credit: Star Schema, when used correctly, can be as beautiful as the actual sky
When a user interacts with a product like Medium, her information, such as her avatar, saved posts, and number of views are all captured by the system. In order to serve them accurately and on time to users, it is critical to optimize the production databases for online transaction processing (OLTP for short).
When it comes to building an online analytical processing system (OLAP for short), the objective is rather different. The designer need to focus on insight generation, meaning analytical reasoning can be translated into queries easily and statistics can be computed efficiently. This analytics-first approach often involves a design process called data modeling.
Data Modeling, Normalization, and Star Schema
To give an example of the design decisions involved, we often need to decide the extent to which tables should be normalized. Generally speaking, normalized tables have simpler schemas, more standardized data, and carry less redundancy. However, a proliferation of smaller tables also means that tracking data relations requires more diligence, querying patterns become more complex (more JOINs), and there are more ETL pipelines to maintain.
On the other hand, it is often much easier to query from a denormalized table (aka a wide table), because all of the metrics and dimensions are already pre-joined. Given their larger sizes, however, data processing for wide tables is slower and involves more upstream dependencies. This makes maintenance of ETL pipelines more difficult because the unit of work is not as modular.
Among the many design patterns that try to balance this trade-off, one of the most commonly-used patterns, and the one we use at Airbnb, is called star schema. The name arose because tables organized in star schema can be visualized with a star-like pattern. This design focuses on building normalized tables, specifically fact and dimension tables. When needed, denormalized tables can be built from these smaller normalized tables. This design strives for a balance between ETL maintainability and ease of analytics.
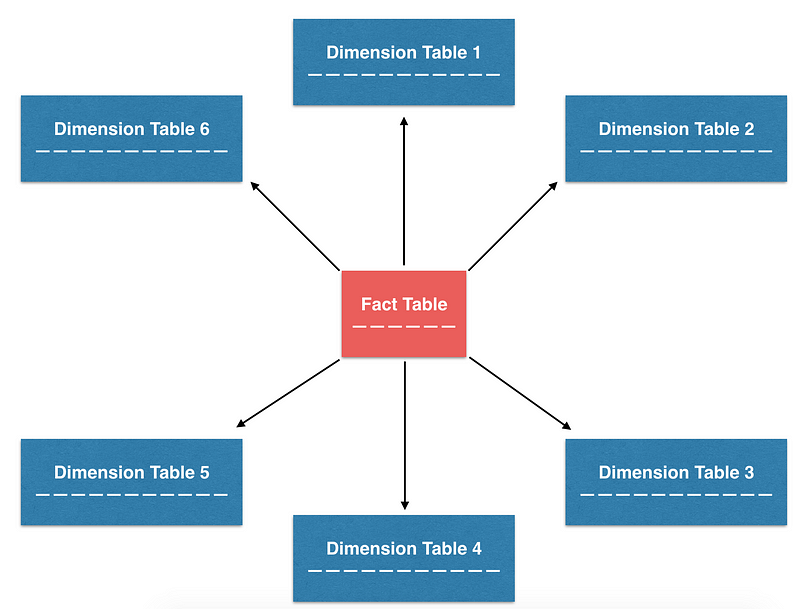
The star schema organized table in a star-like pattern, with a fact table at the center, surrounded by dim tables
Fact & Dimension Tables
To understand how to build denormalized tables from fact tables and dimension tables, we need to discuss their respective roles in more detail:
- Fact tables typically contain point-in-time transactional data. Each row in the table can be extremely simple and is often represented as a unit of transaction. Because of their simplicity, they are often the source of truth tables from which business metrics are derived. For example, at Airbnb, we have various fact tables that track transaction-like events such as bookings, reservations, alterations, cancellations, and more.
- Dimension tables typically contain slowly changing attributes of specific entities, and attributes sometimes can be organized in a hierarchical structure. These attributes are often called “dimensions”, and can be joined with the fact tables, as long as there is a foreign key available in the fact table. At Airbnb, we built various dimension tables such as users, listings, and markets that help us to slice and dice our data.
Below is a simple example of how fact tables and dimension tables (both are normalized tables) can be joined together to answer basic analytics question such as how many bookings occurred in the past week in each market. Shrewd users can also imagine that if additional metrics m_a, m_b, m_c and dimensions dim_x, dim_y, dim_z are projected in the final SELECT clause, a denormalized table can be easily built from these normalized tables.
Normalized tables can be used to answer ad-hoc questions or to build denormalized tables
Data Partitioning & Backfilling Historical Data

In an era where data storage cost is low and computation is cheap, companies now can afford to store all of their historical data in their warehouses rather than throwing it away. The advantage of such an approach is that companies can re-process historical data in response to new changes as they see fit.
Data Partitioning by Datestamp
With so much data readily available, running queries and performing analytics can become inefficient over time. In addition to following SQL best practices such as “filter early and often”, “project only the fields that are needed”, one of the most effective techniques to improve query performance is to partition data.
The basic idea behind data partitioning is rather simple — instead of storing all the data in one chunk, we break it up into independent, self-contained chunks. Data from the same chunk will be assigned with the same partition key, which means that any subset of the data can be looked up extremely quickly. This technique can greatly improve query performance.
In particular, one common partition key to use is datestamp (ds for short), and for good reason. First, in data storage system like S3, raw data is often organized by datestamp and stored in time-labeled directories. Furthermore, the unit of work for a batch ETL job is typically one day, which means new date partitions are created for each daily run. Finally, many analytical questions involve counting events that occurred in a specified time range, so querying by datestamp is a very common pattern. It is no wonder that datestamp is a popular choice for data partitioning!
A table that is partitioned by ds
Backfilling Historical Data
Another important advantage of using datestamp as the partition key is the ease of data backfilling. When a ETL pipeline is built, it computes metrics and dimensions forward, not backward. Often, we might desire to revisit the historical trends and movements. In such cases, we would need to compute metric and dimensions in the past — We called this process data backfilling.
Backfilling is so common that Hive built in the functionality of dynamic partitions, a construct that perform the same SQL operations over many partitions and perform multiple insertions at once. To illustrate how useful dynamic partitions can be, consider a task where we need to backfill the number of bookings in each market for a dashboard, starting from earliest_ds to latest_ds . We might do something like this:
The operation above is rather tedious, since we are running the same query many times but on different partitions. If the time range is large, this work can become quickly repetitive. When dynamic partitions are used, however, we can greatly simplify this work into just one query:
Notice the extra ds in the SELECT and GROUP BY clause, the expanded range in the WHERE clause, and how we changed the syntax from PARTITION (ds= '{{ds}}') to PARTITION (ds) . The beauty of dynamic partitions is that we wrap all the same work that is needed with a GROUP BY ds and insert the results into the relevant ds partitions all at once. This query pattern is very powerful and is used by many of Airbnb’s data pipelines. In a later section, I will demonstrate how one can write an Airflow job that incorporates backfilling logic using Jinja control flow.