What’s Going to Happen this Year in the Data World
"If we wish to foresee the future of mathematics, our proper course is to study the history and present condition of the science." Henri Poncairé.

Introduction
If you are immerse in the data world it’s probable that you’ve seen a bunch of articles, blog posts and news about what’s going to happen this and the upcoming years, the trends and expectations.
I read lots of them, and if you want to do it to go to the end of the article and you’ll find it there. But in here I want to give a quick overview of what’s going on right now, and analyze the different trends people are talking about to see what’s more likely to happen.
The most common trends
If you take a search the term “Data Science” you’ll find around 54 million results, that’s a lot. And the interest in the field has been growing over the years:
But data science is huge right now, and it means different things for different people. If you take a look of the articles and news, the biggest trends are:


There are more but these are the biggest ones. And there’s also a lot to say about each one of them, but I want to focus on two (2) right now. Automation and graphs.
Automation and Graphs (The Data Fabric)

If you’ve been following my research, one of the things I’m most interested right now is the data fabric. Remember that my definition of the data fabric is:
The Data Fabric is the platform that supports all the data in the company. How it’s managed, described, combined and universally accessed. This platform is formed from an Enterprise Knowledge Graph to create an uniform and unified data environment.
And there are two important points I want to make here, the data fabric is formed by the enterprise knowledge graph and it should be as automated as possible.
One of the articles that mention this very clearly is this one from Gartner:
They say:
The application of graph processing and graph DBMSs will grow at 100 percent annually through 2022 to continuously accelerate data preparation and enable more complex and adaptive data science.
and also:
Through 2022, bespoke data fabric designs will be deployed primarily as a static infrastructure, forcing organizations into a new wave of cost to completely re-design for more dynamic data mesh approaches.
It’s very clear that graph concepts and the data fabric will be more common every year for data companies. But what about automation?
There are lots of avances in automation regarding machine learning, deep learning and deployment. But as I said before data is an important asset (maybe the most important one) for companies right now. So before you can apply machine learning or deep learning, at all, you need to have it, know what you have, understand it, govern it, clean it, analyze it, standardize it (maybe more) and then you can think of using it.
We need automation for data storage, data munging, data exploration, data cleansing and all the things we actually spend a lot time doing. You can say that tools like DataRobot can offer you those things, but in my experience there’s much more to do in this field.
That’s why my bet it’s that semantic technologies are the way to go here. With them (like Anzo) you have automatic query generation (yep that’s a thing) and using them against the complex graph makes extracting features easy and eventually fully automated.
Also in one of my first articles on the subject I proposed this architecture:

Where you have automation everywhere. And it’s easy to add more features on the go like explainable AI, continuous intelligence and more. In the same article people at Gartner mentioned:
Continuous intelligence is a design pattern in which real-time analytics are integrated within a business operation, processing current and historical data to prescribe actions in response to events. It provides decision automation or decision support.
Which is not a new term, if we think about streaming analytics, but I like the name. Actually what’s happening can be divided into two things: semantic technologies and automation.
Here’s the interest of semantic technologies over the last 5 years:
As we can see the data fabric is not that high, but I think that’s going to change very soon.
Conclusion
So if you want to be up to date you better start thinking on how to improve your data lakes into smart data lakes, also you want to automate your process, from data ingestion to model deployment and monitoring, and make use of graph technologies.
Again, as I mentioned before you should be using a graph database instead of something else if:
- You have highly related data.
- You need a flexible schema.
- You want to have a structure and build queries that are more similar to way people think.
Instead if you have a highly structured data, you want to do a lot of grouping calculations and you don’t have that many relationships between your tables, then you may be better with a relational database.
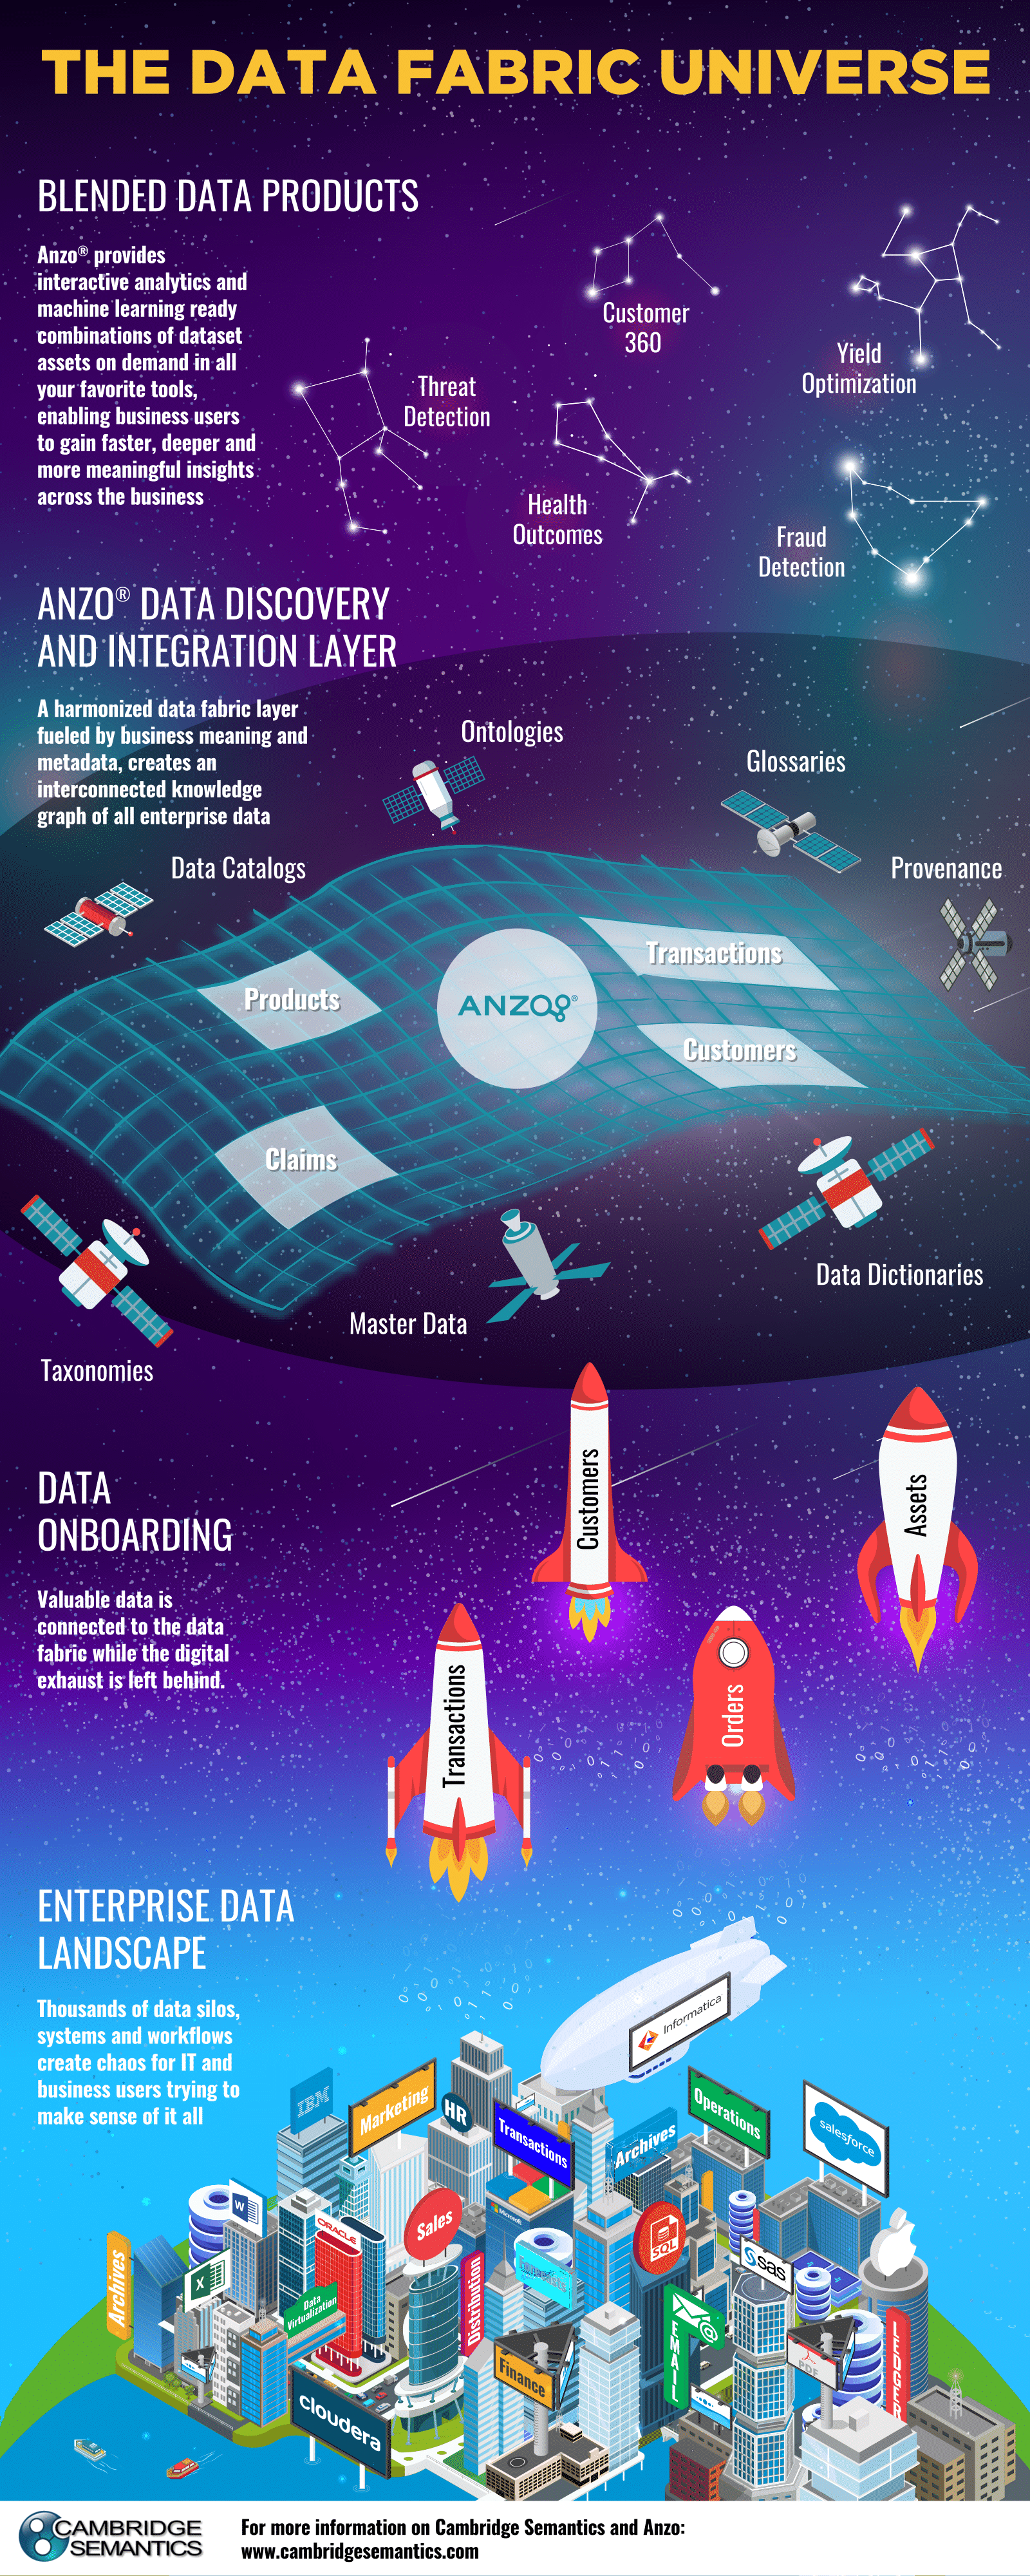
The people at Cambridge Semantics created this great info-graph that let’s you know more about the data fabric universe:
Thanks for reading this, and hopefully the article gave you an idea about what to do in your personal business and life as data scientist.
References:
Bio: Favio Vazquez is a physicist and computer engineer working on Data Science and Computational Cosmology. He has a passion for science, philosophy, programming, and music. He is the creator of Ciencia y Datos, a Data Science publication in Spanish. He loves new challenges, working with a good team and having interesting problems to solve. He is part of Apache Spark collaboration, helping in MLlib, Core and the Documentation. He loves applying his knowledge and expertise in science, data analysis, visualization, and automatic learning to help the world become a better place.
Original. Reposted with permission.
Related:
- An introduction to explainable AI, and why we need it
- Overcoming distrust on the path to productive analytics
- Which Deep Learning Framework is Growing Fastest?