LSTM for time series prediction
Learn how to develop a LSTM neural network with PyTorch on trading data to predict future prices by mimicking actual values of the time series data.
By Roman Orac, Data Scientist.

Time series prediction Photo by rawpixel.com from Pexels.
The idea of using a Neural Network (NN) to predict the stock price movement on the market is as old as NNs. Intuitively, it seems difficult to predict the future price movement looking only at its past. There are many tutorials on how to predict the price trend or its power, which simplifies the problem. I’ve decided to try to predict Volume Weighted Average Price with LSTM because it seems challenging and fun.
In this blog post, I am going to train a Long Short Term Memory Neural Network (LSTM) with PyTorch on Bitcoin trading data and use it to predict the price of unseen trading data. I had quite some difficulties with finding intermediate tutorials with a repeatable example of training an LSTM for time series prediction, so I’ve put together a Jupyter notebook to help you to get started.
Loading Necessary Dependencies
Let’s import the libraries that we are going to use for data manipulation, visualization, training the model, etc. We are going to train the LSTM using PyTorch library.
%matplotlib inline
import glob
import matplotlib
import numpy as np
import pandas as pd
import sklearn
import torch
Loading the Data
We are going to analyze XBTUSD trading data from BitMex. The daily files are publicly available to download. I didn’t bother to write the code to download the data automatically, I’ve simply clicked a couple of times to download the files.
Let’s list all the files, read them to a pandas DataFrame, and filter the trading data by XBTUSD symbol. It is important to sort the DataFrame by timestamp as there are multiple daily files so that they don’t get mixed up.
files = sorted(glob.glob('data/*.csv.gz'))
df = pd.concat(map(pd.read_csv, files))
df = df[df.symbol == 'XBTUSD']
df.timestamp = pd.to_datetime(df.timestamp.str.replace('D', 'T')) # covert to timestamp type
df = df.sort_values('timestamp')
df.set_index('timestamp', inplace=True) # set index to timestamp
df.head()
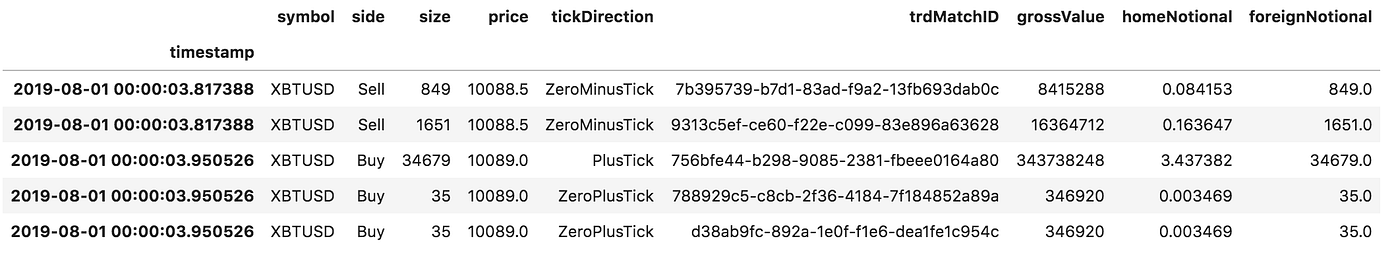
BitMex trade data.
Each row represents a trade:
- timestamp in microsecond accuracy,
- symbol of the contract traded,
- side of the trade, buy or sell,
- size represents the number of contracts (the number of USD traded),
- price of the contract,
- tickDirection describes an increase/decrease in the price since the previous transaction,
- trdMatchID is the unique trade ID,
- grossValue is the number of satoshis exchanged,
- homeNotional is the amount of XBT in the trade,
- foreignNotional is the amount of USD in the trade.
We are going to use 3 columns: timestamp, price, and foreignNotional.
Data Preprocessing
Let’s calculate Volume Weighted Average Price (VWAP) in 1 minute time intervals. The data representation where we group trades by the predefined time interval is called time bars. Is this the best way to represent the trade data for modeling? According to Lopez de Prado, trades on the market are not uniformly distributed over time. There are periods with high activity, e.g., right before future contracts expire, and grouping of data in predefined time intervals would oversample the data in some time bars and undersample it at others. Financial Machine Learning Part 0: Bars is a nice summary of the 2nd Chapter of Lopez de Prado’s book Advances in Financial Machine Learning Book. Time bars may not be the best data representation, but we are going to use them regardless.
df_vwap = df.groupby(pd.Grouper(freq="1Min")).apply(
    lambda row: pd.np.sum(row.price * row.foreignNotional) / pd.np.sum(row.foreignNotional))
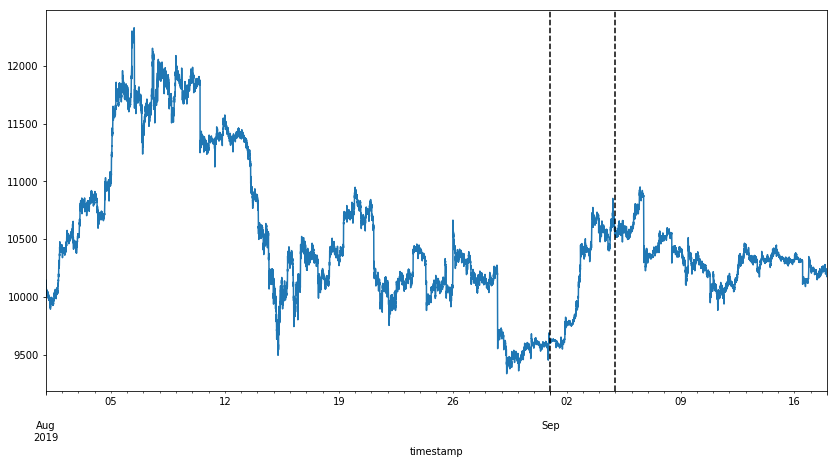
Time bars showing XBTUSD VWAP from 1st of August till the 17th of September 2019.
The plot shows time bars with VWAP from 1st of August till the 17th of September 2019. We are going to use the first part of the data for the training set, part in-between for validation set, and the last part of the data for the test set (vertical lines are delimiters). We can observe volatility in the VWAP, where the price reaches its highs in the first part of August and lows at the end of August. The high and low are captured in the training set, which is important, as the model most probably wouldn’t work well on unseen VWAP intervals.
Scaling the Data
To help the LSTM model to converge faster, it is important to scale the data. It is possible that large values in the inputs slow down the learning. We are going to use StandardScaler from sklearn library to scale the data. The scaler is fit on the training set, and it is used to transform the unseen trade data on validation and test set. If we fit the scalar on all data, the model would overfit, and it would achieve good results on this data, but performance would suffer on the real-world data.
from sklearn.preprocessing import StandardScaler
scaler = StandardScaler()
train_arr = scaler.fit_transform(df_train)
val_arr = scaler.transform(df_val)
test_arr = scaler.transform(df_test)
Transforming the Data
After scaling, we need to transform the data into a format that is appropriate for modeling with LSTM. We transform the long sequence of data into many shorter sequences (100 time bars per sequence) that are shifted by a single time bar.
from torch.autograd import Variable
def transform_data(arr, seq_len):
    x, y = [], []
    for i in range(len(arr) - seq_len):
        x_i = arr[i : i + seq_len]
        y_i = arr[i + 1 : i + seq_len + 1]
        x.append(x_i)
        y.append(y_i)
    x_arr = np.array(x).reshape(-1, seq_len)
    y_arr = np.array(y).reshape(-1, seq_len)
    x_var = Variable(torch.from_numpy(x_arr).float())
    y_var = Variable(torch.from_numpy(y_arr).float())
    return x_var, y_var
seq_len = 100
x_train, y_train = transform_data(train_arr, seq_len)
x_val, y_val = transform_data(val_arr, seq_len)
x_test, y_test = transform_data(test_arr, seq_len)
The plot below shows the first and the second sequence in the training set. The length of both sequences is 100 time bars. We can observe that the target of both sequences is almost the same as the feature, the differences are in the first and in the last time bar.
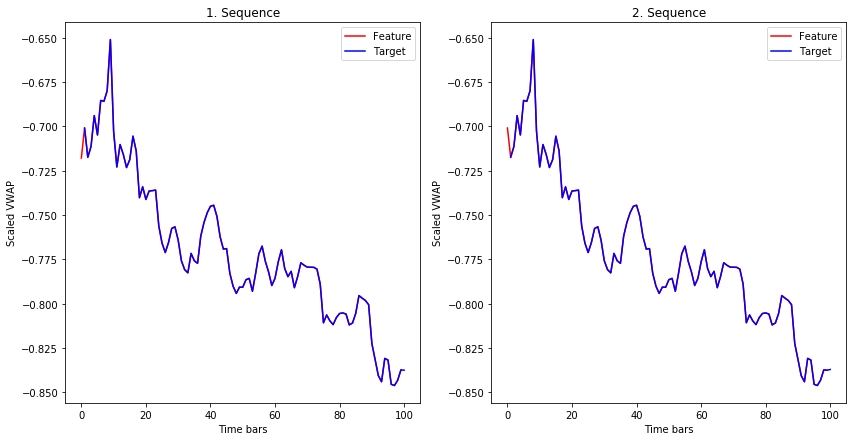
The feature and target of the first and second sequence in the training set.
How does the LSTM use the sequence in the training phase?
Let’s focus on the 1st sequence. The model takes the feature of the time bar at index 0, and it tries to predict the target of the time bar at index 1. Then it takes the feature of the time bar at index 1, and it tries to predict the target of the time bar at index 2, etc. The feature of 2nd sequence is shifted by 1 time bar from the feature of 1st sequence, the feature of 3rd sequence is shifted by 1 time bar from 2nd sequence, etc. With this procedure, we get many shorter sequences that are shifted by a single time bar.
Note that in classification or regression tasks, we usually have a set of features and a target that we are trying to predict. In this example with LSTM, the feature and the target are from the same sequence, so the only difference is that the target is shifted by 1 time bar.
Long Short Term Memory Neural Network
The Long Short Term Memory neural network is a type of a Recurrent Neural Network (RNN). RNNs use previous time events to inform the later ones. For example, to classify what kind of event is happening in a movie, the model needs to use information about previous events. RNNs work well if the problem requires only recent information to perform the present task. If the problem requires long term dependencies, RNN will struggle to model it. The LSTM was designed to learn long term dependencies. It remembers the information for long periods. LSTM was introduced by S Hochreiter, J Schmidhuber in 1997. To learn more about LSTMs, read a great colah blog post , which offers a good explanation.
The code below is an implementation of a stateful LSTM for time series prediction. It has an LSTMCell unit and a linear layer to model a sequence of a time series. The model can generate the future values of a time series, and it can be trained using teacher forcing (a concept that I am going to describe later).
import torch.nn as nn
import torch.optim as optim
class Model(nn.Module):
    def __init__(self, input_size, hidden_size, output_size):
        super(Model, self).__init__()
        self.input_size = input_size
        self.hidden_size = hidden_size
        self.output_size = output_size
        self.lstm = nn.LSTMCell(self.input_size, self.hidden_size)
        self.linear = nn.Linear(self.hidden_size, self.output_size)
    def forward(self, input, future=0, y=None):
        outputs = []
        # reset the state of LSTM
        # the state is kept till the end of the sequence
        h_t = torch.zeros(input.size(0), self.hidden_size, dtype=torch.float32)
        c_t = torch.zeros(input.size(0), self.hidden_size, dtype=torch.float32)
        for i, input_t in enumerate(input.chunk(input.size(1), dim=1)):
            h_t, c_t = self.lstm(input_t, (h_t, c_t))
            output = self.linear(h_t)
            outputs += [output]
        for i in range(future):
            if y is not None and random.random() > 0.5:
                output = y[:, [i]]  # teacher forcing
            h_t, c_t = self.lstm(output, (h_t, c_t))
            output = self.linear(h_t)
            outputs += [output]
        outputs = torch.stack(outputs, 1).squeeze(2)
        return outputs
Training the LSTM
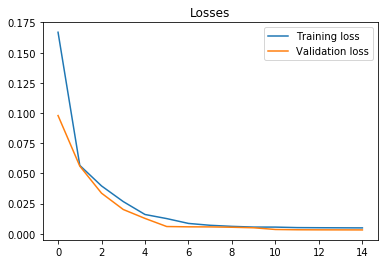
We train LSTM with 21 hidden units. A lower number of units is used so that it is less likely that LSTM would perfectly memorize the sequence. We use Mean Square Error loss function and Adam optimizer. The learning rate is set to 0.001, and it decays every 5 epochs. We train the model with 100 sequences per batch for 15 epochs. From the plot below, we can observe that training and validation loss converge after the sixth epoch.
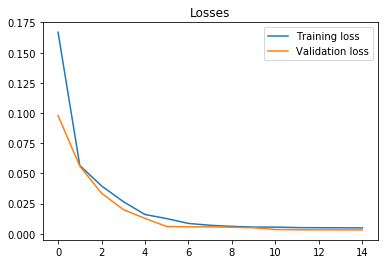
Training and validation loss.
Let’s evaluate the model on the test set. The future parameter is set to 5, which means that the model outputs the VWAP where it believes it will be in the next 5 time bars (5 minutes in our example). This should make the price change visible a few time bars before it occurs.
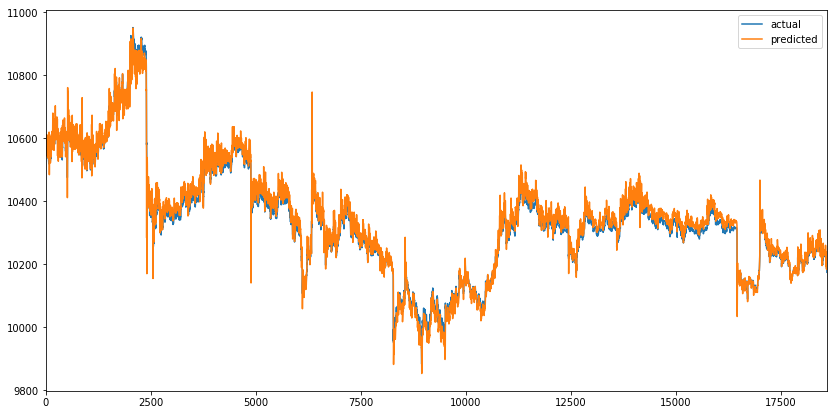
On the plot below, we can observe that predicted values closely match the actual values of VWAP, which seems great at first sight. But the future parameter was set to 5, which means that the orange line should react before a spike occurs instead of covering it.
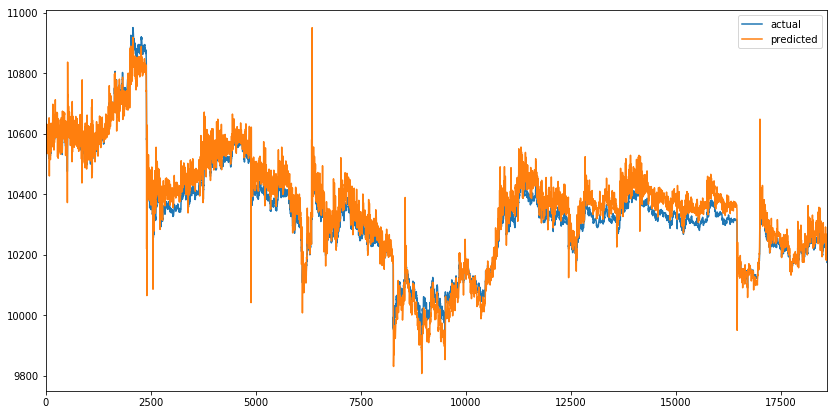
Actual and predicted VWAP on the test set.
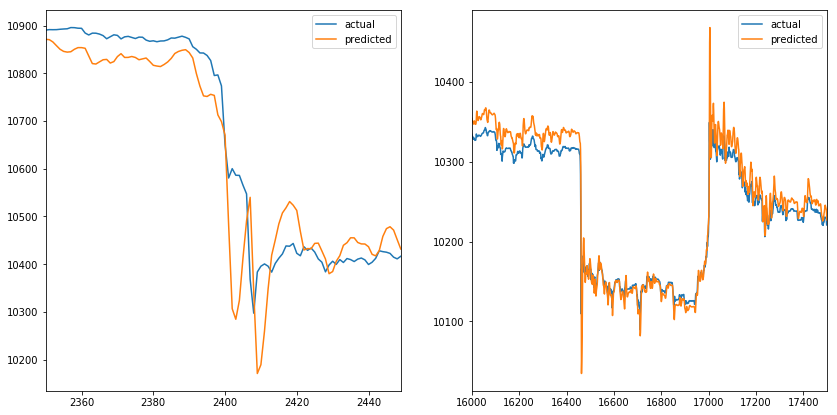
When we zoom into the spikes (one on the start and the other on the end of the time series). We can observe that predicted values mimic the actual values. When the actual value changes direction, predicted value follows, which doesn’t help us much. The same happens when we increase the future parameter (like it doesn’t affect the predicted line).
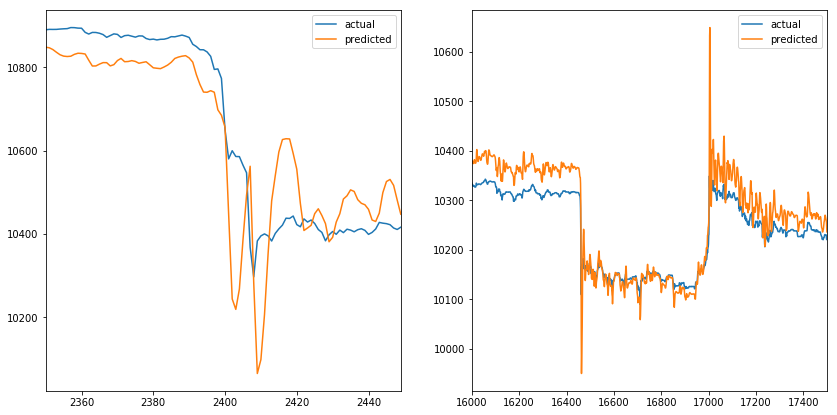
Two VWAP spikes with actual and predicted values.
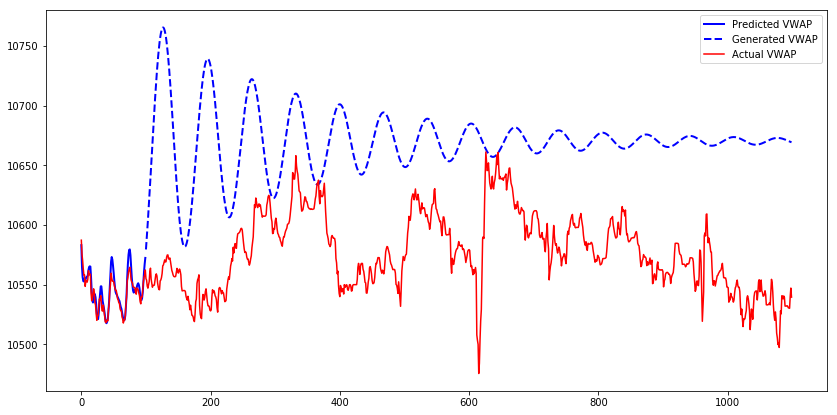
Let’s generate 1000 time bars for the first test sequence with the model and compare predicted, generated, and actual VWAP. We can observe that while the model outputs predicted values, they are close to actual values. But when it starts to generate values, the output almost resembles the sine wave. After a certain period values converge to 9600.
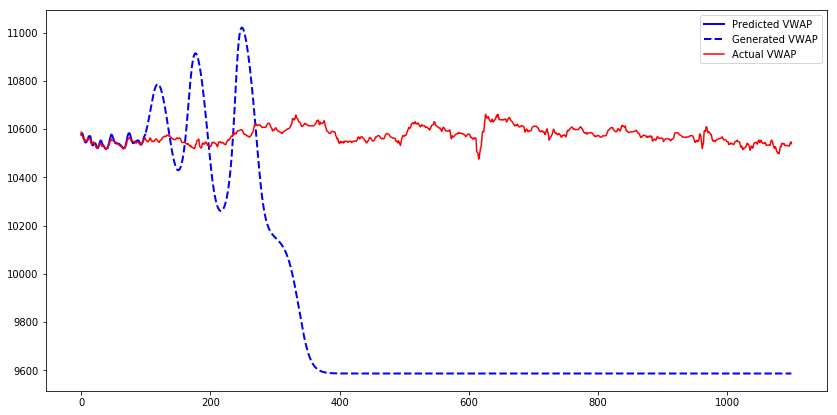
Predicted, generated, and actual VWAP of the first test sequence.
This behavior could occur because the model was trained only with true inputs and never with generated inputs. When the model gets fed the generated output on the input, it does a poor job of generating the next values. Teacher forcing is a concept that deals with this issue.
Teacher Forcing
The Teacher forcing is a method for training Recurrent Neural Networks that use the output from a previous time step as an input. When the RNN is trained, it can generate a sequence by using the previous output as current input. The same process can be used during training, but the model can become unstable, or it does not converge. Teacher forcing is an approach to address those issues during training. It is commonly used in language models.
We are going to use an extension of Teacher forcing, called Scheduled sampling. The model will use its generated output as an input with a certain probability during training. At first, the probability of a model seeing its generated output is small, and then it gradually increases during training. Note that in this example, we use a random probability, which doesn’t increase during the training process.
Let’s train a model with the same parameters as before, but with the teacher forcing enabled. After 7 epochs, the training and validation loss converge.
Training and validation loss with teacher forcing.
Actual and predicted VWAP on the test set with teacher forcing.
We can observe a similar predicted sequence as before. When we zoom into the spikes, similar behavior of the model can be observed, where predicted values mimic the actual values. It seems like teacher forcing didn’t solve the problem.
Two VWAP spikes with actual and predicted values with teacher forcing.
Let’s generate 1000 time bars for the first test sequence with the model trained with teacher forcing.
Predicted, generated, and actual VWAP of the first test sequence with teacher forcing.
The generated sequence from the model trained with teacher forcing needs longer to converge. Another observation about the generated sequence is that when it is increasing, it will continue to increase to some point, then start to decrease, and the pattern repeats until the sequence converges. The pattern looks like a sine wave with a decreasing amplitude.
Conclusion
The result of this experiment is that the predictions of the model mimic the actual values of the sequence. The first and second models do not detect price changes before they occur. Adding another feature (like volume) might help the model to detect the price changes before they occur, but then the model would need to generate two features to use the output of those as input in the next step, which would complicate the model. Using a more complex model (multiple LSTMCells, increase the number of hidden units) might not help as the model has the capacity to predict the VWAP time series, as seen in the plots above. More advanced methods of teacher forcing might help so that the model would improve sequence generation skills.
References
- Time Sequence Prediction
- Understanding LSTM Networks
- What is Teacher Forcing for Recurrent Neural Networks?
- Scheduled Sampling for Sequence Prediction with Recurrent Neural Networks
Original. Reposted with permission.
Bio: Roman Orac is a Senior Data Scientist with notable successes in improving systems for document classification, item recommendation and risk modeling. He obtained a master's degree in computer science from University in Ljubljana, He has experience with managing teams, mentoring beginners and explaining complex concepts to non-engineers. He is currently consulting various companies on projects related to Data Science.
Related: