 How to ace the data science coding challenge
 How to ace the data science coding challenge
Preparing to interview for a Data Scientist position takes preparation and practice, and then it could all boil down to a final review of your skills. Based on personal experience, these tips on how to approach such a review will help you excel in the coding challenge project for your next interview.

Image Source: Pexels.
The Take-Home Challenge Problem (Coding Exercise)
So, you’ve successfully gone through the initial screening phase of the interview process. It is now time for the most important step in the interview process, namely, the take-home coding challenge. This is generally a data science problem, e.g., machine learning model, linear regression, classification problem, time series analysis, etc.
Data science coding projects vary in scope and complexity. Sometimes, the project could be as simple as producing summary statistics, charts, and visualizations. It could also involve building a regression model, classification model, or forecasting using a time-dependent dataset. The project could also be very complex and difficult. In this case, no clear guidance is provided as to the specific type of model to use. In this case, you’ll have to come up with your own model that is best suitable for addressing project goals and objectives.
Generally, the interview team will provide you with project directions and a dataset. If you are fortunate, they may provide a small dataset that is clean and stored in a comma-separated value (CSV) file format. That way, you don’t have to worry about mining the data and transforming it into a form suitable for analysis. For the couple of interviews I had, I worked with 2 types of datasets: one had 160 observations (rows), while the other had 50,000 observations with lots of missing values. The take-home coding exercise clearly differs from companies to companies, as further described below.
In this article, I will share some useful tips from my personal experience that would help you excel in the coding challenge project. Before delving into the tips, let’s first examine some sample coding exercises.
Sample 1 Coding Exercise: Model for recommending cruise ship crew size
Instructions
This coding exercise should be performed in python (which is the programming language used by the team). You are free to use the internet and any other libraries. Please save your work in a Jupyter notebook and email it to us for review.
Data file: cruise_ship_info.csv (this file will be emailed to you)
Objective: Build a regressor that recommends the “crew” size for potential ship buyers. Please do the following steps (hint: use numpy, scipy, pandas, sklearn and matplotlib)
- Read the file and display columns.
- Calculate basic statistics of the data (count, mean, std, etc) and examine data and state your observations.
- Select columns that will probably be important to predict “crew” size.
- If you removed columns, explain why you removed those.
- Use one-hot encoding for categorical features.
- Create training and testing sets (use 60% of the data for the training and reminder for testing).
- Build a machine learning model to predict the ‘crew’ size.
- Calculate the Pearson correlation coefficient for the training set and testing datasets.
- Describe hyper-parameters in your model and how you would change them to improve the performance of the model.
- What is regularization? What is the regularization parameter in your model?
Plot regularization parameter value vs Pearson correlation for the test and training sets, and see whether your model has a bias problem or variance problem.
This is an example of a very straightforward problem. The dataset is clean and small (160 rows and 9 columns), and the instructions are very clear. So, all that is needed is to follow the instructions and generate your code. Notice also that the instruction clearly specifies that python must be used as the programming language for model building. The time allowed for completing this coding assignment was three days. Only the final Jupyter notebook has to be submitted, and no formal project report is required.
Tips for Acing Sample 1 Coding Exercise
Since the project involves building a machine learning model, the first step is to ensure we understand the machine learning process:

Figure 1. Illustrating the Machine Learning Process. Image by Benjamin O. Tayo.
1. Problem Framing
Define your project goals. What do you want to find out? Do you have the data to analyze?
Objective: The goal of this project is to build a regressor model that recommends the “crew” size for potential cruise ship buyers using the cruise ship dataset cruise_ship_info.csv.
2. Data Analysis
Import and clean the dataset, analyze features to select the relevant features that correlate with the target variable.
2.1 Import dataset and display features and the target variable
df = pd.read_csv("cruise_ship_info.csv")

df.head()

Table 1: Shows first 5 rows of dataset.
In this example, the dataset is clean and pristine, with no missing values. So, no cleaning is required.
Remarks on Data Quality: One of the major flaws with the dataset is that it does not provide the units for the features. For example, the passenger’s column doesn’t tell if this column is in hundreds or thousands. The units for cabin length, passenger density, and crew are not provided as well. The passenger_density feature seems to have been derived from other features, but there is no explanation of how it was derived. These kinds of issues can be addressed by contacting the interview team to ask more about the dataset. It is important to understand the intricacies of your data before using it for building real-world models. Keep in mind that a bad dataset leads to bad predictive models.
2.2 Calculate and visualize the covariance matrix
The covariance matrix plot can be used for feature selection and for quantifying the correlation between features (multi-collinearity). We observe from Figure 2 that there are strong correlations between features.
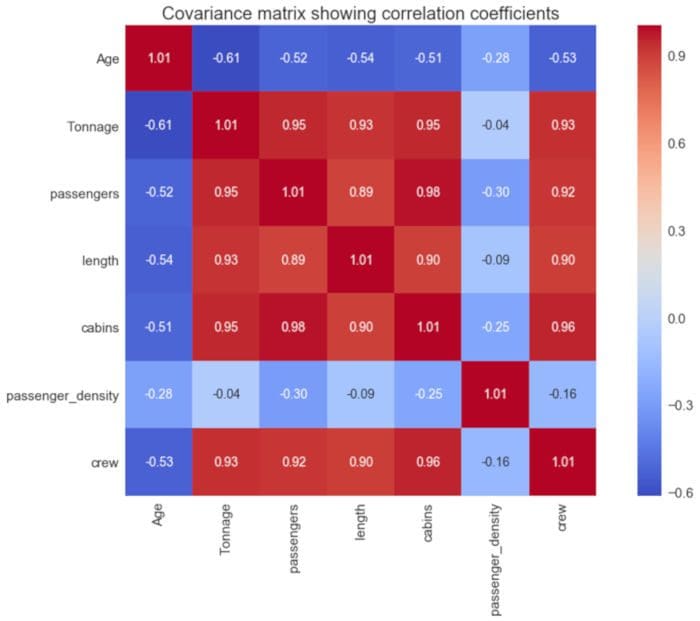
Figure 2. Covariance matrix plot.
2.3 Perform feature engineering by transforming features into the principal component analysis (PCA) space
Since the covariance matrix shows multi-collinearity, it is important to transform features into PCA space before training your model. This is important because multi-collinearity between features can lead to a model that is complex and difficult to interpret. PCA can also be used for variable selection and dimensionality reduction. In this case, only components that contribute significantly to the total explained variance can be retained and used for modeled building.
3. Model Building
Pick the machine learning tool that matches your data and desired outcome. Train the model with available data.
3.1 Model building and evaluation
Since our goal is to use regression, one could implement different regression algorithms such as Linear Regression (LR), KNeighbors Regression (KNR), and Support Vector Regression (SVR). The dataset has to be divided into training, validation, and test sets. Hyperparameter tuning has to be used to fine-tune the model in order to prevent overfitting. Cross-validation is essential to ensure the model performs well on the validation set. After fine-tuning model parameters, the model is applied has to be applied to the test dataset. The model’s performance on the test dataset is approximately equal to what would be expected when the model is used for making predictions using unseen data.
3.2 Uncertainty Quantification
This can be done by training a model using different random partitions of the training dataset, then averaging the cross-validation score for each random state parameter.

Figure 3. Mean cross-validation shows for different regression models.
4. Application
Score your final model to generate predictions. Make your model available for production. Retrain your model as needed.
In this stage, the final machine learning model is selected and put into production. The model is evaluated in a production setting in order to assess its performance. Any mistakes encountered when transforming from an experimental model to its actual performance on the production line has to be analyzed. This can then be used in fine-tuning the original model.
Based on the mean cross-validation score from Figure 3, we observe that Linear Regression and Support Vector Regression perform almost at the same level and better than KNeighbors Regression. So, the final model selected could either be Linear Regression or Support Vector Regression.
For a complete solution of sample 1 coding exercise, please see the following links:
Machine Learning Process Tutorial
Remarks on Sample 1 Coding Exercise
Sometimes the coding exercise would ask you to submit a Jupyter notebook only, or it may ask for a full project report. Make sure your Jupyter notebook is well organized to reflect every stage of the machine learning process. A sample Jupyter notebook can be found here: ML_Model_for_Predicting_Ships_Crew_Size.
Sample 2 Coding Exercise: Model for forecasting loan status
Instructions
In this problem, you will forecast the outcome of a portfolio of loans. Each loan is scheduled to be repaid over 3 years and is structured as follows:
- First, the borrower receives the funds. This event is called origination.
- The borrower then makes regular repayments until one of the following happens:
(i) The borrower stops making payments, typically due to financial hardship, before the end of the 3-year term. This event is called charge-off, and the loan is then said to have charged off.
(ii) The borrower continues making repayments until 3 years after the origination date. At this point, the debt has been fully repaid.
In the attached CSV, each row corresponds to a loan, and the columns are defined as follows:
- The column with header days since origination indicates the number of days that elapsed between origination and the date when the data was collected.
- For loans that charged off before the data was collected, the column with header days from origination to charge-off indicates the number of days that elapsed between origination and charge-off. For all other loans, this column is blank.
Objective: We would like you to estimate what fraction of these loans will have charged off by the time all of their 3-year terms are finished. Please include a rigorous explanation of how you arrived at your answer, and include any code you used. You may make simplifying assumptions, but please state such assumptions explicitly. Feel free to present your answer in whatever format you prefer; in particular, PDF and Jupyter Notebook are both fine. Also, we expect that this project will not take more than 3–6 hours of your time.
The dataset here is complex (has 50,000 rows and 2 columns, and lots of missing values), and the problem is not very straightforward. You have to examine the dataset critically and then decide what model to use. This problem was to be solved in a week. It also specifies that a formal project report and an R script or Jupyter notebook file be submitted.
Tips for Acing Sample 2 Coding Exercise
As in Sample 1 coding exercise, you need to follow the machine learning steps when tackling this problem. This particle problem does not have a unique solution. I attempted a solution using probabilistic modeling based on Monte-Carlo simulation.
For a complete solution of sample 1 coding exercise, please see the following links:
R Script for Data Science Coding Exercise
Project Report for Data Science Coding Exercise
Remarks on Sample 2 Coding Exercise
The solutions presented above are recommended solutions only. Keep in mind that the solution to a data science or machine learning project is not unique. I challenge you to solve these problems before reviewing the sample solutions.
Summary
In summary, we’ve discussed some useful tips that could be beneficial for any data science aspirant currently applying for data science openings. The coding exercise varies in scope and complexity, depending on the company you are applying to. The take-home coding exercise provides an excellent opportunity for you to showcase your ability to work on a data science project. You need to use this opportunity to demonstrate exceptional abilities in your understanding of data science and machine learning concepts. Don’t let this wonderful opportunity slip away. If there are certain aspects of the project that you don’t understand, feel free to reach out to the data science interview team if you have questions. They may provide some hints or clues.
Related: