 20 Core Data Science Concepts for Beginners
 20 Core Data Science Concepts for Beginners
With so much to learn and so many advancements to follow in the field of data science, there are a core set of foundational concepts that remain essential. Twenty of these ideas are highlighted here that are key to review when preparing for a job interview or just to refresh your appreciation of the basics.
1. Dataset
Just as the name implies, data science is a branch of science that applies the scientific method to data with the goal of studying the relationships between different features and drawing out meaningful conclusions based on these relationships. Data is, therefore, the key component in data science. A dataset is a particular instance of data that is used for analysis or model building at any given time. A dataset comes in different flavors such as numerical data, categorical data, text data, image data, voice data, and video data. A dataset could be static (not changing) or dynamic (changes with time, for example, stock prices). Moreover, a dataset could depend on space as well. For example, temperature data in the United States would differ significantly from temperature data in Africa. For beginning data science projects, the most popular type of dataset is a dataset containing numerical data that is typically stored in a comma-separated values (CSV) file format.
2. Data Wrangling
Data wrangling is the process of converting data from its raw form to a tidy form ready for analysis. Data wrangling is an important step in data preprocessing and includes several processes like data importing, data cleaning, data structuring, string processing, HTML parsing, handling dates and times, handling missing data, and text mining.

Figure 1: Data wrangling process. Image by Benjamin O. Tayo
The process of data wrangling is a critical step for any data scientist. Very rarely is data easily accessible in a data science project for analysis. It is more likely for the data to be in a file, a database, or extracted from documents such as web pages, tweets, or PDFs. Knowing how to wrangle and clean data will enable you to derive critical insights from your data that would otherwise be hidden.
An example of data wrangling using the college towns dataset can be found here: Tutorial on Data Wrangling
3. Data Visualization
Data Visualization is one of the most important branches of data science. It is one of the main tools used to analyze and study relationships between different variables. Data visualization (e.g., scatter plots, line graphs, bar plots, histograms, qqplots, smooth densities, boxplots, pair plots, heat maps, etc.) can be used for descriptive analytics. Data visualization is also used in machine learning for data preprocessing and analysis, feature selection, model building, model testing, and model evaluation. When preparing a data visualization, keep in mind that data visualization is more of an Art than Science. To produce a good visualization, you need to put several pieces of code together for an excellent end result. A tutorial on data visualization is found here: Tutorial on data visualization using weather dataset
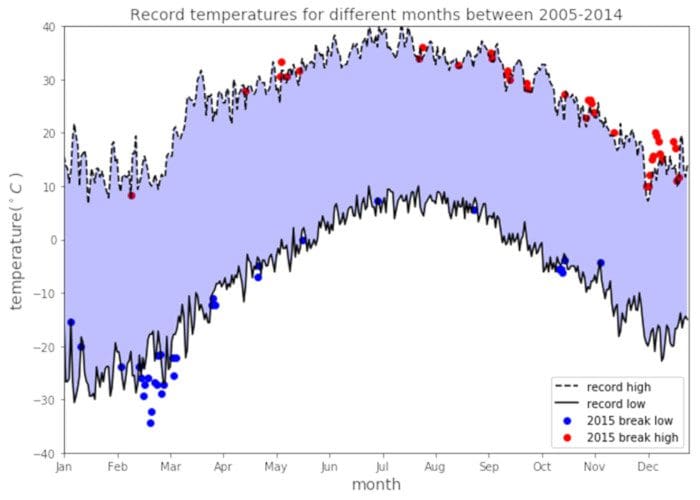
Figure 2: Weather data visualization example. Image by Benjamin O. Tayo
4. Outliers
An outlier is a data point that is very different from the rest of the dataset. Outliers are often just bad data, e.g., due to a malfunctioned sensor; contaminated experiments; or human error in recording data. Sometimes, outliers could indicate something real such as a malfunction in a system. Outliers are very common and are expected in large datasets. One common way to detect outliers in a dataset is by using a box plot. Figure 3 shows a simple regression model for a dataset containing lots of outliers. Outliers can significantly degrade the predictive power of a machine learning model. A common way to deal with outliers is to simply omit the data points. However, removing real data outliers can be too optimistic, leading to non-realistic models. Advanced methods for dealing with outliers include the RANSAC method.
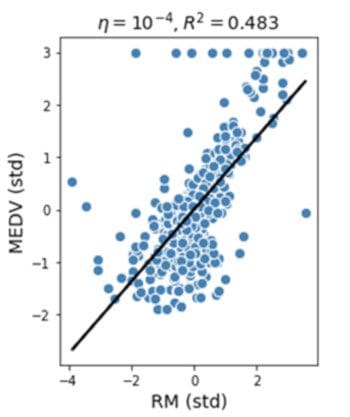
Figure 3: Simple regression model using a dataset with outliers. Image by Benjamin O. Tayo
5. Data Imputation
Most datasets contain missing values. The easiest way to deal with missing data is simply to throw away the data point. However, the removal of samples or dropping of entire feature columns is simply not feasible because we might lose too much valuable data. In this case, we can use different interpolation techniques to estimate the missing values from the other training samples in our dataset. One of the most common interpolation techniques is mean imputation, where we simply replace the missing value with the mean value of the entire feature column. Other options for imputing missing values are median or most frequent (mode), where the latter replaces the missing values with the most frequent values. Whatever imputation method you employ in your model, you have to keep in mind that imputation is only an approximation, and hence can produce an error in the final model. If the data supplied was already preprocessed, you would have to find out how missing values were considered. What percentage of the original data was discarded? What imputation method was used to estimate missing values?
6. Data Scaling
Scaling your features will help improve the quality and predictive power of your model. For example, suppose you would like to build a model to predict a target variable creditworthiness based on predictor variables such as income and credit score. Because credit scores range from 0 to 850 while annual income could range from $25,000 to $500,000, without scaling your features, the model will be biased towards the income feature. This means the weight factor associated with the income parameter will be very small, which will cause the predictive model to be predicting creditworthiness based only on the income parameter.
In order to bring features to the same scale, we could decide to use either normalization or standardization of features. Most often, we assume data is normally distributed and default towards standardization, but that is not always the case. It is important that before deciding whether to use either standardization or normalization, you first take a look at how your features are statistically distributed. If the feature tends to be uniformly distributed, then we may use normalization (MinMaxScaler). If the feature is approximately Gaussian, then we can use standardization (StandardScaler). Again, note that whether you employ normalization or standardization, these are also approximative methods and are bound to contribute to the overall error of the model.
7. Principal Component Analysis (PCA)
Large datasets with hundreds or thousands of features often lead to redundancy especially when features are correlated with each other. Training a model on a high-dimensional dataset having too many features can sometimes lead to overfitting (the model captures both real and random effects). In addition, an overly complex model having too many features can be hard to interpret. One way to solve the problem of redundancy is via feature selection and dimensionality reduction techniques such as PCA. Principal Component Analysis (PCA) is a statistical method that is used for feature extraction. PCA is used for high-dimensional and correlated data. The basic idea of PCA is to transform the original space of features into the space of the principal component. A PCA transformation achieves the following:
a) Reduce the number of features to be used in the final model by focusing only on the components accounting for the majority of the variance in the dataset.
b) Removes the correlation between features.
An implementation of PCA can be found at this link: PCA Using Iris Dataset
8. Linear Discriminant Analysis (LDA)
PCA and LDA are two data preprocessing linear transformation techniques that are often used for dimensionality reduction to select relevant features that can be used in the final machine learning algorithm. PCA is an unsupervised algorithm that is used for feature extraction in high-dimensional and correlated data. PCA achieves dimensionality reduction by transforming features into orthogonal component axes of maximum variance in a dataset. The goal of LDA is to find the feature subspace that optimizes class separability and reduce dimensionality (see figure below). Hence, LDA is a supervised algorithm. An in-depth description of PCA and LDA can be found in this book: Python Machine Learning by Sebastian Raschka, Chapter 5.
An implementation of LDA can be found at this link: LDA Using Iris Dataset
9. Data Partitioning
In machine learning, the dataset is often partitioned into training and testing sets. The model is trained on the training dataset and then tested on the testing dataset. The testing dataset thus acts as the unseen dataset, which can be used to estimate a generalization error (the error expected when the model is applied to a real-world dataset after the model has been deployed). In scikit-learn, the train/test split estimator can be used to split the dataset as follows:
X_train, X_test, y_train, y_test = train_test_split(X, y, test_size = 0.3)
Here, X is the features matrix, and y is the target variable. In this case, the testing dataset is set to 30%.
10. Supervised Learning
These are machine learning algorithms that perform learning by studying the relationship between the feature variables and the known target variable. Supervised learning has two subcategories:
a) Continuous Target Variables
Algorithms for predicting continuous target variables include Linear Regression, KNeighbors regression (KNR), and Support Vector Regression (SVR).
A tutorial on Linear and KNeighbors Regression is found here: Tutorial on Linear and KNeighbors Regression
b) Discrete Target Variables
Algorithms for predicting discrete target variables include:
- Perceptron classifier
- Logistic Regression classifier
- Support Vector Machines (SVM)
- Decision tree classifier
- K-nearest classifier
- Naive Bayes classifier
11. Unsupervised Learning
In unsupervised learning, we are dealing with unlabeled data or data of unknown structure. Using unsupervised learning techniques, we are able to explore the structure of our data to extract meaningful information without the guidance of a known outcome variable or reward function. K-means clustering is an example of an unsupervised learning algorithm.
12. Reinforcement Learning
In reinforcement learning, the goal is to develop a system (agent) that improves its performance based on interactions with the environment. Since the information about the current state of the environment typically also includes a so-called reward signal, we can think of reinforcement learning as a field related to supervised learning. However, in reinforcement learning, this feedback is not the correct ground truth label or value but a measure of how well the action was measured by a reward function. Through the interaction with the environment, an agent can then use reinforcement learning to learn a series of actions that maximize this reward.
13. Model Parameters and Hyperparameters
In a machine learning model, there are two types of parameters:
a) Model Parameters: These are the parameters in the model that must be determined using the training data set. These are the fitted parameters. For example, suppose we have a model such as house price = a + b*(age) + c*(size), to estimate the cost of houses based on the age of the house and its size (square foot), then a, b, and c will be our model or fitted parameters.
b) Hyperparameters: These are adjustable parameters that must be tuned to obtain a model with optimal performance. An example of a hyperparameter is shown here:
KNeighborsClassifier(n_neighbors = 5, p = 2, metric = 'minkowski')
It is important that during training, the hyperparameters be tuned to obtain the model with the best performance (with the best-fitted parameters).
A tutorial on model parameters and hyperparameters is found here: Tutorial on model parameters and hyperparameters in machine learning
14. Cross-validation
Cross-validation is a method of evaluating a machine learning model’s performance across random samples of the dataset. This assures that any biases in the dataset are captured. Cross-validation can help us to obtain reliable estimates of the model’s generalization error, that is, how well the model performs on unseen data.
In k-fold cross-validation, the dataset is randomly partitioned into training and testing sets. The model is trained on the training set and evaluated on the testing set. The process is repeated k-times. The average training and testing scores are then calculated by averaging over the k-folds.
Here is the k-fold cross-validation pseudocode:

Figure 4. k-fold cross-validation pseudocode. Image by Benjamin O. Tayo
An implementation of cross-validation is found here: Hands-on cross-validation tutorial
15. Bias-variance Tradeoff
In statistics and machine learning, the bias-variance tradeoff is the property of a set of predictive models whereby models with a lower bias in parameter estimation have a higher variance of the parameter estimates across samples and vice versa. The bias-variance dilemma or problem is the conflict in trying to simultaneously minimize these two sources of error that prevent supervised learning algorithms from generalizing beyond their training set:
- The bias is an error from erroneous assumptions in the learning algorithm. High bias (overly simple) can cause an algorithm to miss the relevant relations between features and target outputs (underfitting).
- The variance is an error from sensitivity to small fluctuations in the training set. High variance (overly complex) can cause an algorithm to model the random noise in the training data rather than the intended outputs (overfitting).
It is important to find the right balance between model simplicity and complexity. A tutorial on bias-variance tradeoff can be found here: Tutorial on bias-variance tradeoff
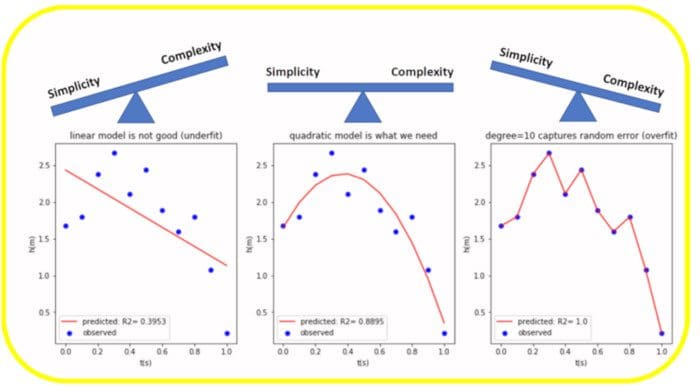
Figure 5. Illustration of bias-variance tradeoff. Image by Benjamin O. Tayo
16. Evaluation Metrics
In machine learning (predictive analytics), there are several metrics that can be used for model evaluation. For example, a supervised learning (continuous target) model can be evaluated using metrics such as the R2 score, mean square error (MSE), or mean absolute error (MAE). Furthermore, a supervised learning (discrete target) model, also referred to as a classification model, can be evaluated using metrics such as accuracy, precision, recall, f1 score, and the area under ROC curve (AUC).
17. Uncertainty Quantification
It is important to build machine learning models that will yield unbiased estimates of uncertainties in calculated outcomes. Due to the inherent randomness in the dataset and model, evaluation parameters such as the R2 score are random variables, and thus it is important to estimate the degree of uncertainty in the model. For an example of uncertainty quantification, see this article: Random Error Quantification in Machine Learning
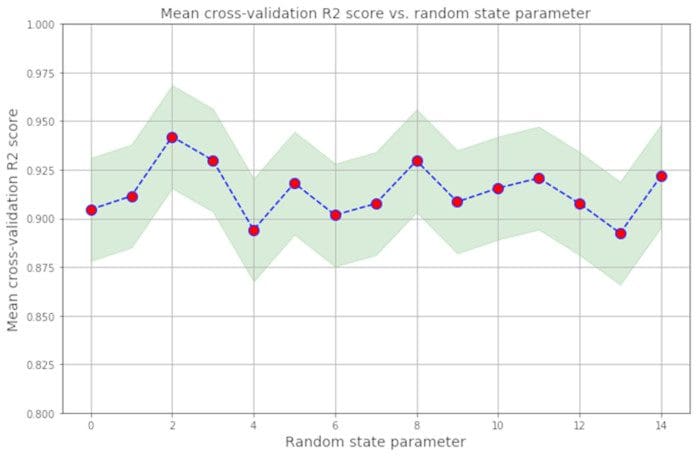
Figure 6. Illustration of fluctuations in R2 score. Image by Benjamin O. Tayo
18. Math Concepts
a) Basic Calculus: Most machine learning models are built with a dataset having several features or predictors. Hence, familiarity with multivariable calculus is extremely important for building a machine learning model. Here are the topics you need to be familiar with:
Functions of several variables; Derivatives and gradients; Step function, Sigmoid function, Logit function, ReLU (Rectified Linear Unit) function; Cost function; Plotting of functions; Minimum and Maximum values of a function
b) Basic Linear Algebra: Linear algebra is the most important math skill in machine learning. A data set is represented as a matrix. Linear algebra is used in data preprocessing, data transformation, dimensionality reduction, and model evaluation. Here are the topics you need to be familiar with:
Vectors; Norm of a vector; Matrices; Transpose of a matrix; The inverse of a matrix; The determinant of a matrix; Trace of a Matrix; Dot product; Eigenvalues; Eigenvectors
c) Optimization Methods: Most machine learning algorithms perform predictive modeling by minimizing an objective function, thereby learning the weights that must be applied to the testing data in order to obtain the predicted labels. Here are the topics you need to be familiar with:
Cost function/Objective function; Likelihood function; Error function; Gradient Descent Algorithm and its variants (e.g., Stochastic Gradient Descent Algorithm)
19. Statistics and Probability Concepts
Statistics and Probability are used for visualization of features, data preprocessing, feature transformation, data imputation, dimensionality reduction, feature engineering, model evaluation, etc. Here are the topics you need to be familiar with:
Mean, Median, Mode, Standard deviation/variance, Correlation coefficient and the covariance matrix, Probability distributions (Binomial, Poisson, Normal), p-value, Bayes Theorem (Precision, Recall, Positive Predictive Value, Negative Predictive Value, Confusion Matrix, ROC Curve), Central Limit Theorem, R_2 score, Mean Square Error (MSE), A/B Testing, Monte Carlo Simulation
Here are some educational resources on Central Limit Theorem and Bayes Theorem:
Illustration of Central Limit Theorem Using Monte-Carlo Simulation
Bayes Theorem Explained Using Heights Dataset
20. Productivity Tools
A typical data analysis project may involve several parts, each including several data files and different scripts with code. Keeping all these organized can be challenging. Productivity tools help you to keep projects organized and to maintain a record of your completed projects. Some essential productivity tools for practicing data scientists include tools such as Unix/Linux, git and GitHub, RStudio, and Jupyter Notebook. Find out more about productivity tools here: Productivity Tools in Machine Learning
Related: