10 Statistical Concepts You Should Know For Data Science Interviews
Data Science is founded on time-honored concepts from statistics and probability theory. Having a strong understanding of the ten ideas and techniques highlighted here is key to your career in the field, and also a favorite topic for concept checks during interviews.

Business vector created by pch.vector, www.freepik.com.
Statistics can feel really overwhelming at times, and it’s no surprise as the practice of statistics has been around for thousands of years!
When it comes to data science interviews, however, there are only so many concepts that interviewers test. After going through hundreds and hundreds of data science interview questions, I compiled the 10 statistical concepts that came up the most often.
In this article, I’m going to go over these 10 concepts, what they’re all about, and why they’re so important.
With that said, here we go!
1) P-values
The most technical and precise definition of a p-value is that it is the probability of achieving a result that’s just as extreme or more extreme than the result if the null hypothesis is too.
If you think about it, this makes sense. In practice, if the p-value is less than the alpha, say of 0.05, then we’re saying that there’s a probability of less than 5% that the result could have happened by chance. Similarly, a p-value of 0.05 is the same as saying, “5% of the time, we would see this by chance.”
So if the initial definition doesn’t stick with you, remember the example I just gave above!
2) Confidence Intervals and Hypothesis Testing
Confidence intervals and hypothesis testing share a very close relationship. The confidence interval suggests a range of values for an unknown parameter and is then associated with a confidence level that the true parameter is within the suggested range of. Confidence intervals are often very important in medical research to provide researchers with a stronger basis for their estimations.
A confidence interval can be shown as “10 +/- 0.5” or [9.5, 10.5] to give an example.
Hypothesis testing is the basis of any research question and often comes down to trying to prove something did not happen by chance. For example, you could try to prove when rolling a dye that one number was more likely to come up than the rest.
3) Z-tests vs. T-tests
Understanding the differences between z-tests and t-tests as well as how and when you should choose to use each of them, is invaluable in statistics.
A Z-test is a hypothesis test with a normal distribution that uses a z-statistic. A z-test is used when you know the population variance or if you don’t know the population variance but have a large sample size.
A T-test is a hypothesis test with a t-distribution that uses a t-statistic. You would use a t-test when you don’t know the population variance and have a small sample size.
You can see the image below as a reference to guide which test you should use:
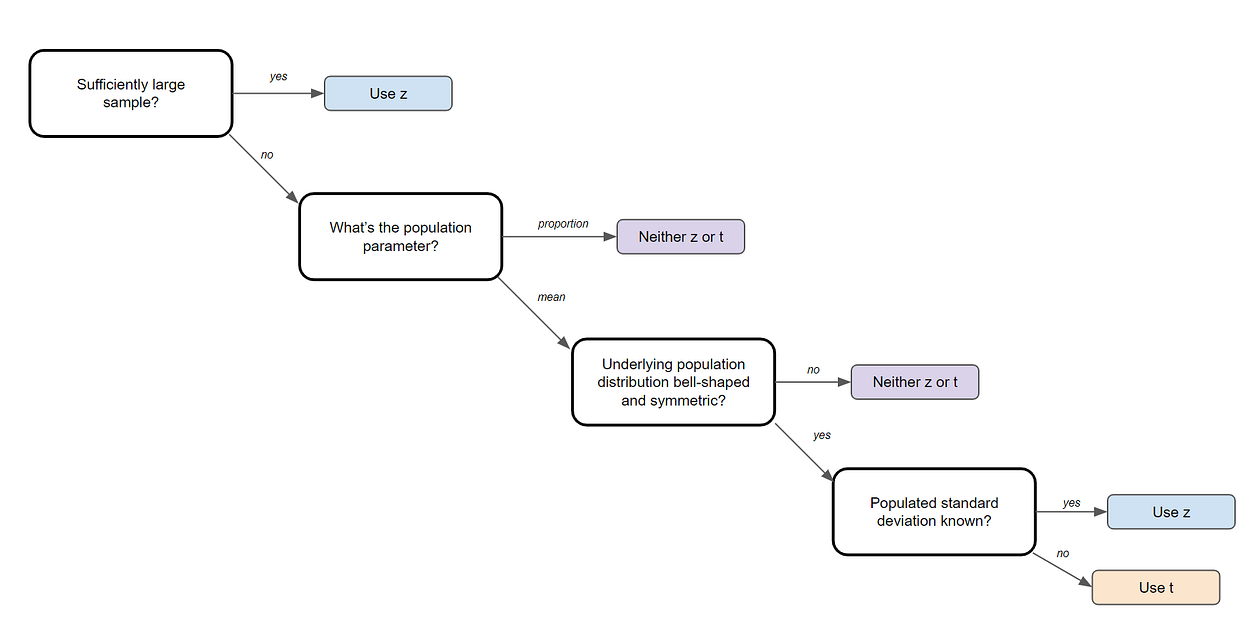
Image Created by Author.
4) Linear regression and its assumptions
Linear Regression is one of the most fundamental algorithms used to model relationships between a dependent variable and one or more independent variables. In simpler terms, it involves finding the ‘line of best fit’ that represents two or more variables.
The line of best fit is found by minimizing the squared distances between the points and the line of best fit — this is known as minimizing the sum of squared residuals. A residual is simply equal to the predicted value minus the actual value.

Image Created by Author.
In case it doesn’t make sense yet, consider the image above. By comparing the green line of best fit to the red line, notice how the vertical lines (the residuals) are much bigger for the green line than the red line. This makes sense because the green line is so far away from the points that it isn’t a good representation of the data at all!
There are four assumptions associated with a linear regression model:
- Linearity: The relationship between X and the mean of Y is linear.
- Homoscedasticity: The variance of the residual is the same for any value of X.
- Independence: Observations are independent of each other.
- Normality: For any fixed value of X, Y is normally distributed.
5) Logistic regression
Logistic regression is similar to linear regression but is used to model the probability of a discrete number of outcomes, typically two. For example, you might want to predict whether a person is alive or dead, given their age.
At a glance, logistic regression sounds much more complicated than linear regression but really only has one extra step.
First, you calculate a score using an equation similar to the equation for the line of best fit for linear regression.

The extra step is feeding the score that you previously calculated in the sigmoid function below so that you get a probability in return. This probability can then be converted to a binary output, either 1 or 0.

To find the weights of the initial equation to calculate the score, methods like gradient descent or maximum likelihood are used. Since it’s beyond the scope of this article, I won’t go into much more detail, but now you know how it works!
6) Sampling techniques
There are 5 main ways that you can sample data: Simple Random, Systematic, Convenience, Cluster, and Stratified sampling.
Simple Random Sampling
Simple random sampling requires using randomly generated numbers to choose a sample. More specifically, it initially requires a sampling frame, a list or database of all members of a population. You can then randomly generate a number for each element, using Excel, for example, and take the first n samples that you require.
Systematic Sampling
Systematic sampling can be even easier to do. You simply take one element from your sample, skip a predefined amount (n) and then take your next element. Going back to our example, you could take every fourth name on the list.
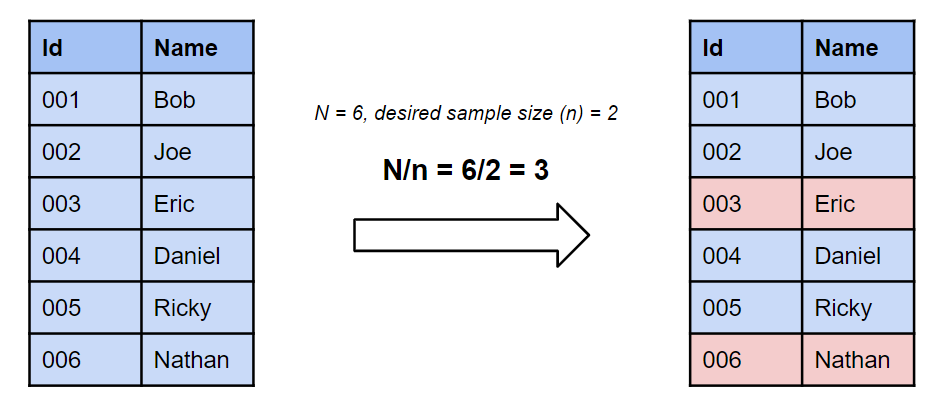
Image created by Author.
Convenience Sampling
Convenience sampling takes a sample from a group that is easy to contact, for example, asking people outside a shopping center. You just sample the first people you run into. This technique is often considered poor practice to use as your data could be viewed as bias.
Cluster Sampling
Cluster sampling starts by dividing a population into groups or clusters. What makes this different that stratified sampling is that each cluster must be representative of the population. Then, you randomly select entire clusters to sample.
For example, if an elementary school had five different grade eight classes, cluster random sampling might be used, and only one class would be chosen as a sample.
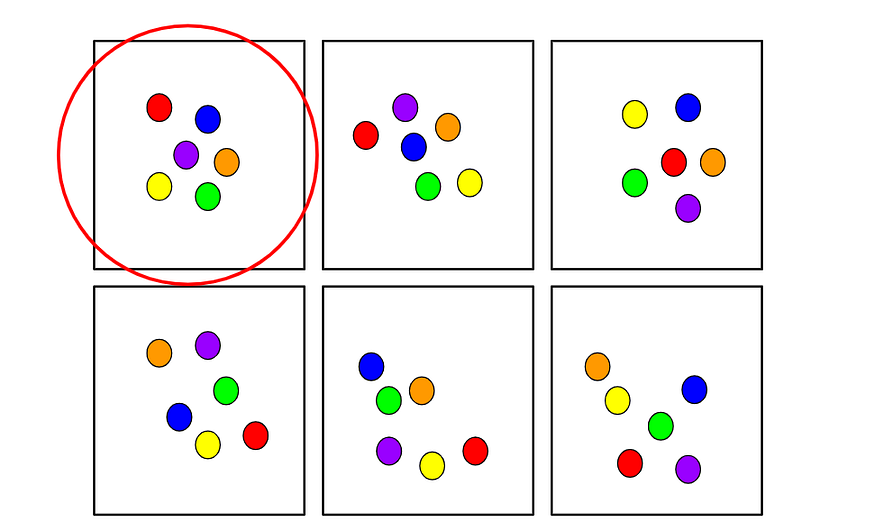
Image created by Author.
Stratified Sampling
Stratified random sampling starts off by dividing a population into groups with similar attributes. Then a random sample is taken from each group. This method is used to ensure that different segments in a population are equally represented. To give an example, imagine a survey is conducted at a school to determine overall satisfaction. It might make sense here to use stratified random sampling to equally represent the opinions of students in each department.
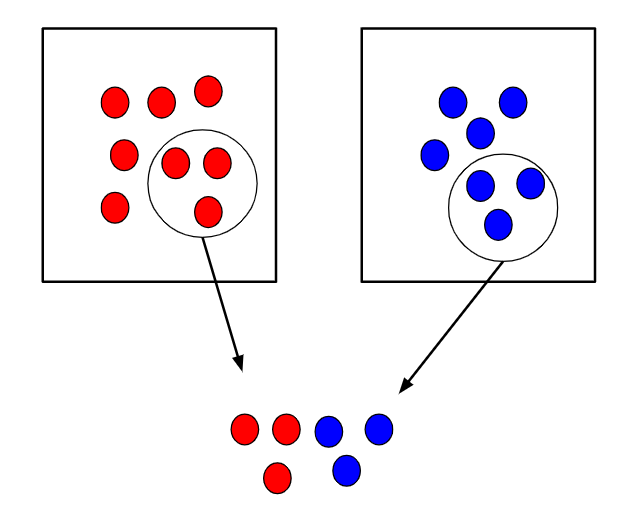
Image created by Author.
7) Central Limit Theorem
The central limit theorem is very powerful — it states that the distribution of sample means approximates a normal distribution.
To give an example, you would take a sample from a data set and calculate the mean of that sample. Once repeated multiple times, you would plot all your means and their frequencies onto a graph and see that a bell curve, also known as a normal distribution, has been created.
The mean of this distribution will closely resemble that of the original data. You can improve the accuracy of the mean and reduce the standard deviation by taking larger samples of data and more samples overall.
8) Combinations and Permutations
Combinations and permutations are two slightly different ways that you can select objects from a set to form a subset. Permutations take into consideration the order of the subset, whereas combinations do not.
Combinations and permutations are extremely important if you’re working on network security, pattern analysis, operations research, and more. Let’s review each in further detail.
Permutations
Definition: A permutation of n elements is any arrangement of those n elements in a definite order. There are n factorial (n!) ways to arrange n elements. Note the bold: order matters!
The number of permutations of n things taken r-at-a-time is defined as the number of r-tuples that can be taken from n different elements and is equal to the following equation:

Example Question: How many permutations does a license plate have with 6 digits, using only digits 1 thru 9?

Answer.
Combinations
Definition: The number of ways to choose r out of n objects where order doesn’t matter.
The number of combinations of n things taken r-at-a-time is defined as the number of subsets with r elements of a set with n elements and is equal to the following equation:

Example Question: How many ways can you draw 6 cards from a deck of 52 cards?

Answer.
Note that these are very, very simple questions and that it can get much more complicated than this, but you should have a good idea of how it works with the examples above!
9) Bayes Theorem/Conditional Probability
Bayes theorem is a conditional probability statement, and essentially it looks at the probability of one event (B) happening given that another event (A) has already happened.
One of the most popular machine learning algorithms, Naïve Bayes, is built on these two concepts. Additionally, if you enter the realm of online machine learning, you’ll most likely be using Bayesian methods.

Bayes Theorem Equation.

Conditional Probability Equation.
10) Probability Distributions
A probability distribution is an easy way to find your probabilities of different possible outcomes in an experiment. There are many different distribution types you should learn about, but a few I would recommend are Normal, Uniform, and Poisson.
Normal Distribution
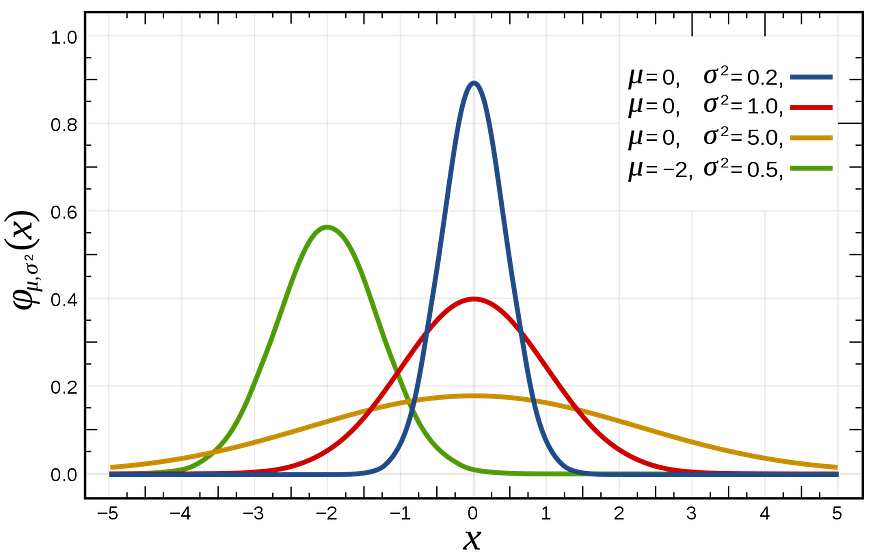
The normal distribution, also known as the Gaussian distribution, is a bell-shaped curve that is quite prominent in many distributions, including the height of people and IQ scores.
The mean of the normal distribution is equal to μ, and the variance is equal to σ.
Poisson Distribution
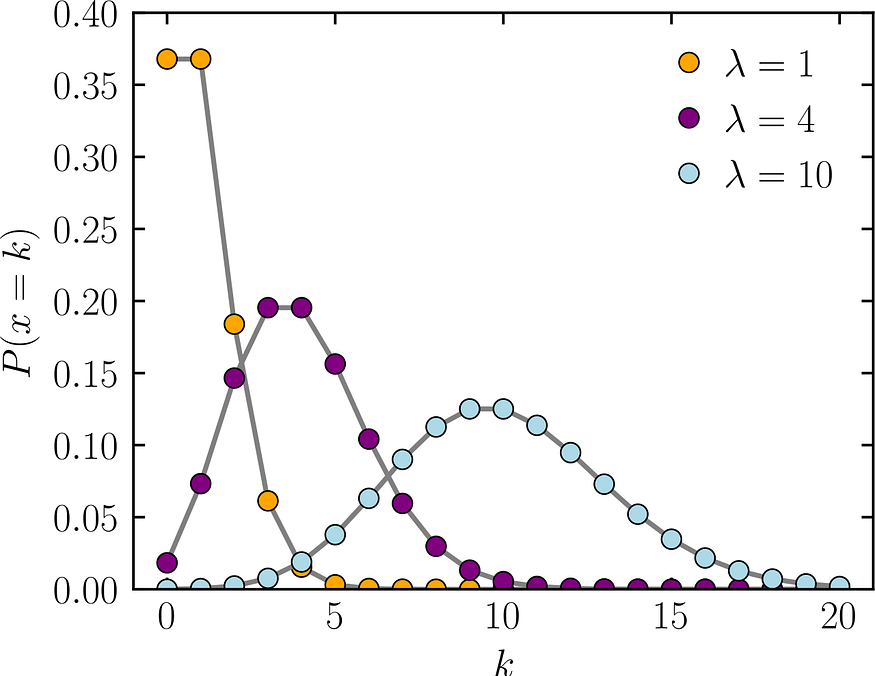
The Poisson distribution is a discrete distribution that gives the probability of the number of independent events occurring in a fixed time. An example of when you would use this is if you want to determine the likelihood of X patients coming into a hospital in a given hour.
The mean and variance are both equal to λ.
Uniform Distribution
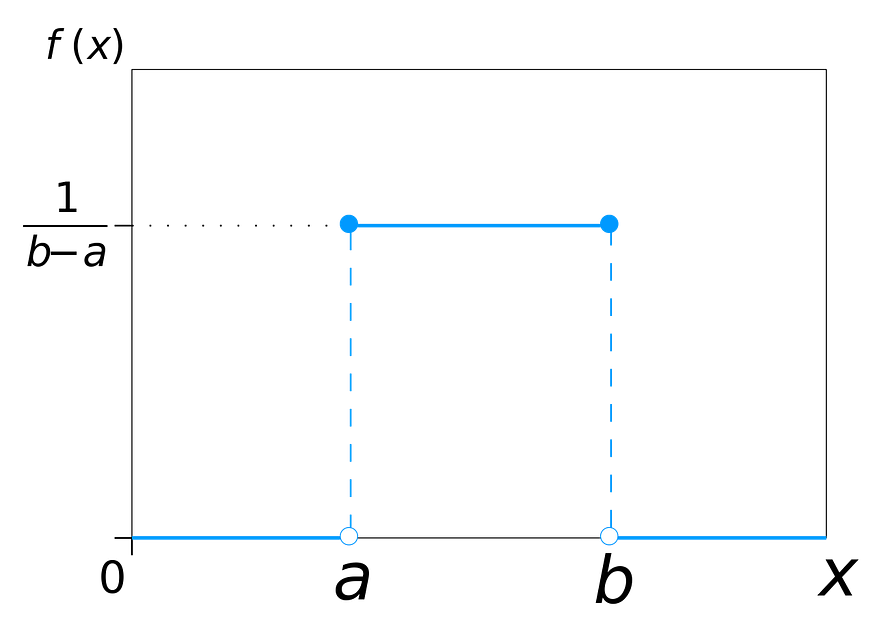
A uniform distribution is used when all outcomes are equally likely. For example, a coin has a uniform distribution as well as a dye.
Original. Reposted with permission.
Related: