
Statistics and Probability for Data Science
In this article, we discuss the importance of statistics and probability in data science and machine learning.

Vector by iconicbestiary
Key Takeaways
- Most beginners interested in getting into the field of data science are always concerned about the math requirements.
- Data science is a very quantitative field that requires advanced mathematics.
- But to get started, you only need to master a few math topics.
- In this article, we discuss the importance of statistics and probability in data science and machine learning.
Statistics and Probability
Statistics and Probability is used for visualization of features, data preprocessing, feature transformation, data imputation, dimensionality reduction, feature engineering, model evaluation, etc. This article will focus on the fundamental Statistics and Probability concepts for beginners in the field, namely: Mean or Expectation Value, Variance and Standard Deviation, Confidence Interval, Central Limit Theorem, Correlation and Covariance, Probability Distribution, and Bayes’ Theorem.
Mean or Expectation Value
Let X be a random variable with N observations, then the mean value of X is given by

The mean or expectation value is a measure of central tendency.
Variance and Standard Deviation
Let X be a random variable with N observations, then the variance of X is given by:
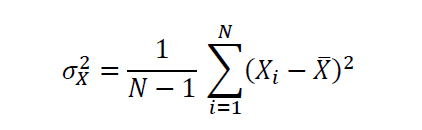
The standard deviation is the square root of the variance and is a measure of uncertainty or volatility.
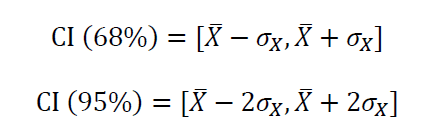
Confidence Interval
Assuming that the random variable X is normally distributed, then the 68% and 95% confidence intervals (CI) are given by

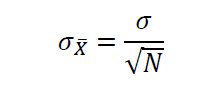
Central Limit Theorem (CLT)
The Central Limit Theorem (CLT) states that the sample mean of a probability distribution sample is a random variable with a mean value given by population mean and standard deviation given by population standard deviation divided by square root of N, where N is the sample size.
Let  be the population mean, and the population standard deviation. If we draw a small sample from the population with size N, then according to the CLT, the sample mean is given as

and the sample standard deviation is given by
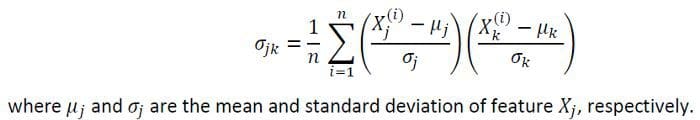
Correlation and Covariance
Correlation and covariance are measures of co-movement in a dataset. To quantify the degree of correlation between features, we can compute the covariance matrix using this equation:
Probability Distribution
Even though we always assume that variables or features in a dataset are normally distributed, it is important to plot the probability distribution to visualize how a feature is distributed. For example, using the heights dataset contained in R’s dslabs package, we can compute the probability distribution of all heights in the dataset, as shown in Figure 2 below.
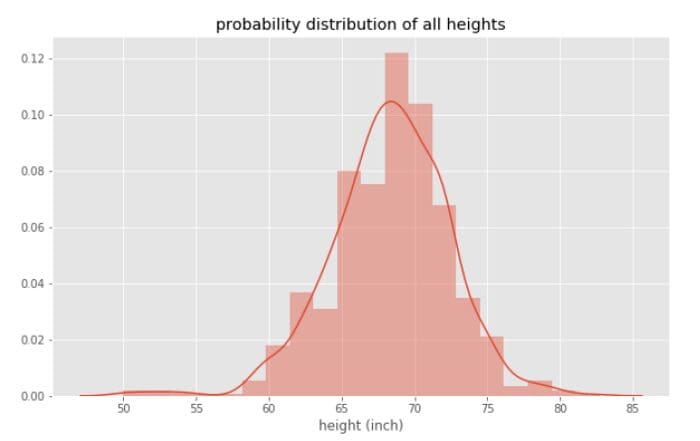
Figure 2
From Figure 2, we observe that the heights dataset is approximately normal, with a mean value of about 68 inches. Now if we plot the probability distribution for Male and Female heights separately, we observe two distinct curves, as shown in Figure 3.
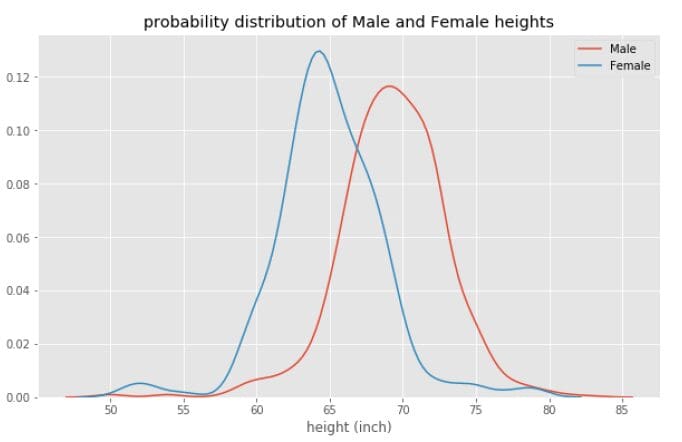
Figure 3
From Figure 3, we observe that the mean Female height (~ 63 inch) is less than the mean Male height (~ 69 inch), which indicates that statistically speaking, Males are on average taller than Females. For more information and code used for generating Figures 2 and 3, please see this article: Bayes’ Theorem Explained.
Bayes’ Theorem
Bayes’ theorem plays an important role in binary classification problems. It is used to interpret the output from a binary classification algorithm. Bayes’ theorem states that the conditional probabilities of two events A and B are related by this equation:
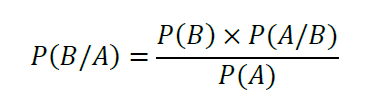
For an implementation of Bayes’ theorem in a binary classification problem, please see this article: Bayes’ Theorem Explained.
Summary
In summary, we’ve discussed 7 important concepts in probability and statistics that are essential for data science beginners. Other advance topics include AB Testing, Hypothesis Testing, Monte-Carlo Simulations, etc.
Benjamin O. Tayo is a Physicist, Data Science Educator, and Writer, as well as the Owner of DataScienceHub. Previously, Benjamin was teaching Engineering and Physics at U. of Central Oklahoma, Grand Canyon U., and Pittsburgh State U.