


Confusion Matrix, Precision, and Recall Explained
Learn these key machine learning performance metrics to ace data science interviews.
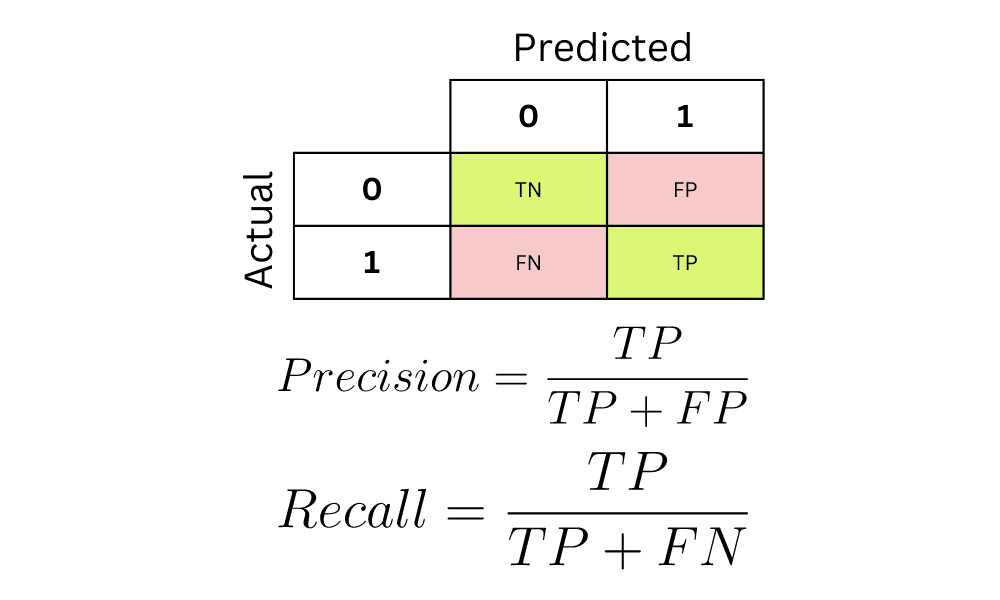
Image by Editor
A confusion matrix is a table used to summarize the performance of a classification model.
In case you aren’t familiar, classification models are machine learning algorithms used to solve problems that have a categorical outcome, such as predicting whether an email is a spam or not.
Accuracy is the most popular metric used to evaluate classification models.
However, it isn’t always the most reliable, which is why data scientists generate confusion matrices and use metrics like precision and recall instead.
Confusion matrices are one of the most frequently tested concepts by data science interviewers. Hiring managers often ask candidates to interpret confusion matrices, or provide them with a use case and ask them to calculate a model’s precision and recall by hand.
Due to this, it is important to thoroughly understand how these techniques work and when they should be used in place of accuracy.
In this article, we will cover the following concepts to solidify your understanding of classification metrics:
- The limitations of classification accuracy
- What is a confusion matrix, and why is it used?
- How to read a confusion matrix
- What are precision and recall, and how do they overcome the limitations of classification accuracy?
- How to generate a confusion matrix in Python
Limitations of Classification Accuracy
Let us look at a simple example to understand where classification accuracy fails:
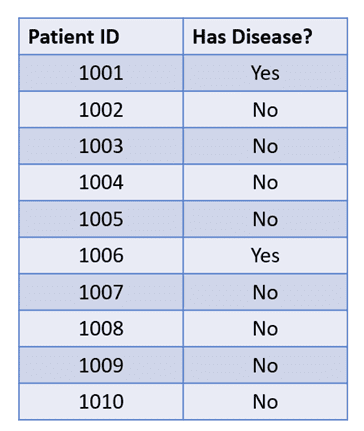
The table above contains data related to 10 patients. 8 out of 10 patients do not have a rare disease, while 2 of them do.
This is an example of an imbalanced classification problem.
If your dataset has skewed proportions, i.e. there is an over-representation of one class and an under-representation of another, then the dataset is imbalanced.
In this case, even if the classification model that you build always predicts the majority class, the accuracy will be high.
In this example, if the model always predicts that the patient does not have the disease, it will be correct 8 out of 10 times and will have an 80% accuracy:
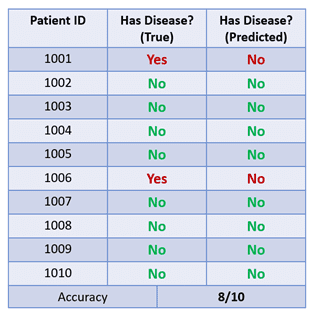
This is a bad model as it always predicts the majority class, but its high accuracy can trick us into thinking that the model is performing well.
Since accuracy does not always show us the full picture, we can use a confusion matrix instead to tell us how well the model is actually performing.
What is a Confusion Matrix?
A confusion matrix summarizes the performance of a classifier and allows us to identify details that accuracy does not tell us.
To better understand how it works, let’s build a confusion matrix based on the table above:
The above image displays the structure of a confusion matrix. Here is how it can be interpreted:
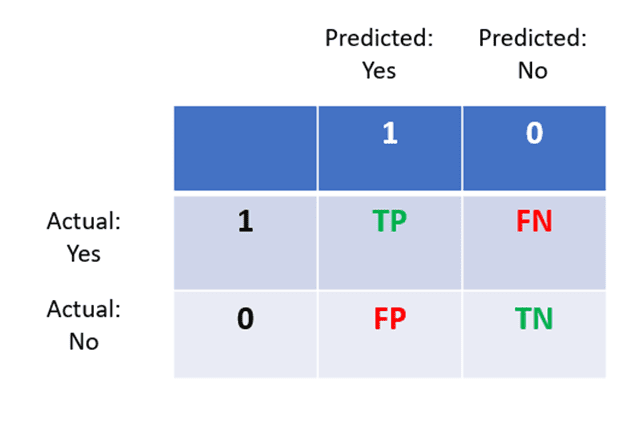
- The columns represent actual values, and rows represent predictions.
- If a person actually has a disease and the model accurately predicts that they have the disease, then it is called a true positive.
- If a person does not have the disease and the model predicts “no,” then this is a true negative.
- True positives and true negatives form a diagonal in the confusion matrix. We can calculate a model’s accuracy with the following formula:

- If a person has the disease (yes) but the model predicts “no,” this is a false negative.
- Finally, if a person does not have the disease (no) but the model predicts “yes”, then this is a false positive.
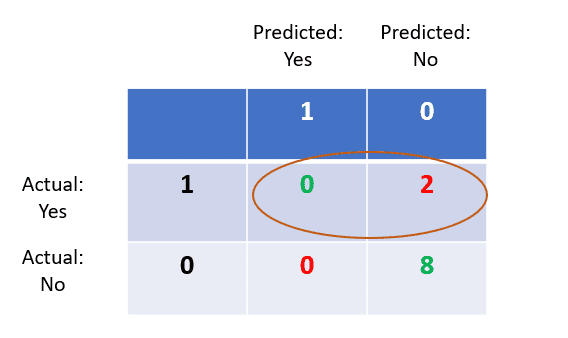
Now, let’s fill out the confusion matrix based on the disease prediction data.
Step 1: True Positives
Recall that this means the number of people accurately predicted to have the disease. Since the model has predicted “No” for every patient, there are 0 true positives in this dataset.
Step 2: True Negatives
There are 8 patients who do not have the disease, and the model managed to identify all of them. So there are 8 true negatives.
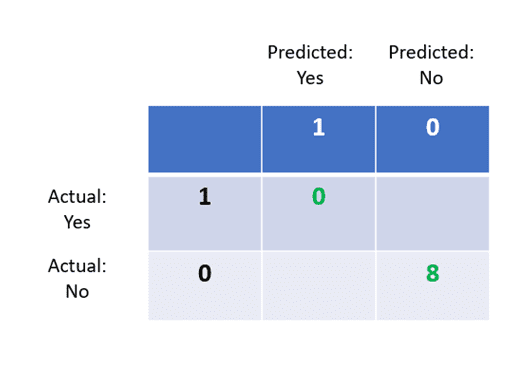
Step 3: False Positives
These are the people who do not have the disease, but the model predicted “Yes.” Since our model has never predicted “Yes,” there are 0 false positives.
Step 4: False Negatives
These are people who do have the disease, but the model predicted “No.” There are 2 false negatives in the dataset.
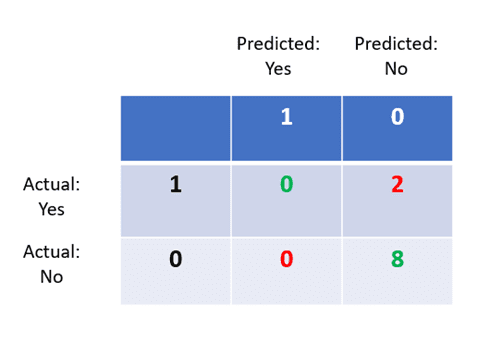
Now, although we know that this model has an 80% accuracy, we can tell that there is something wrong with it by just looking at its confusion matrix.
The entire “Predicted: Yes” column of the confusion matrix has zeros in it, which tells us that the model has not predicted that even one person has the disease.
The model is only predicting the majority class “No”, indicating that it’s doing a poor job at disease classification and must be refined.
Precision and Recall
Now that you understand how a confusion matrix works, let’s dive into two more metrics that can be computed from it.
Precision and recall are two popular classification metrics that data scientists use to optimize model performance. They give us insight into model performance that accuracy does not tell us.
Precision
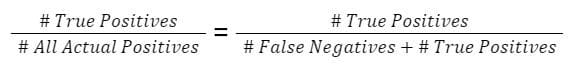
Precision is a metric that tells us about the quality of positive predictions. Out of everyone predicted to have the disease, how many of them actually have it?
It is calculated using the following formula:

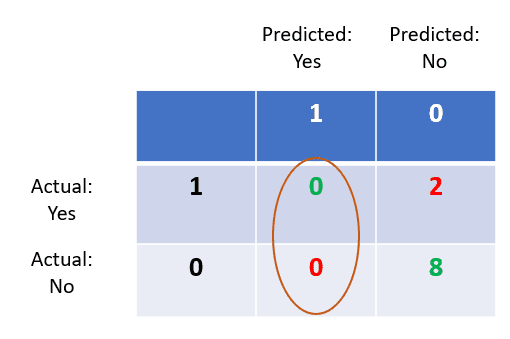
In this case, we only look at the left hand side of the confusion matrix.
The number of true positives is 0.
All predicted positives include the sum of true positives and false positives, which is also 0.
Hence, the model’s precision is 0/0+0 = 0.
Recall
Recall tells us about how well the model identifies true positives. Out of all the patients who have the disease, how many were correctly identified?
In this case, the number of true positives is 0. The number of false negatives is 2.
Hence, the model’s recall is 0/2+0 = 0.
Notice that both precision and recall are zero in this example. This is because the model has no true positives, marking the classifier as useless as it was unable to make even one correct positive prediction.
What is a “good” classification model?
A good classifier should have high accuracy, precision, and recall.
In some use-cases, data scientists optimize their model to have higher precision or recall depending on the scenario.
A model with higher recall than precision often makes more positive predictions. A model like this comes with higher false positives and low false negatives.
In scenarios like disease prediction, models should always be optimized for recall. False positives are better than false negatives in the healthcare industry.
On the other hand, a model with higher precision will have fewer false positives and more false negatives. If you were to build a bot detection machine learning model for an online store, you may want to optimize for higher precision, since banning legitimate users from the website will lead to a decline in sales.
It is important to properly understand this concept, as data science interviewers often present use-cases like the ones above and ask candidates whether to optimize for precision or recall.
How to Build a Confusion Matrix in Python
You can run the following lines of code to build a confusion matrix using Scikit-Learn in Python:
from sklearn.metrics import confusion_matrix

true = [1, 0, 0, 0, 0, 1, 0, 0, 0, 0]

predicted = [0, 0, 0, 0, 0, 0, 0, 0, 0, 0]

print(confusion_matrix(true, predicted))
Natassha Selvaraj is a self-taught data scientist with a passion for writing. You can connect with her on LinkedIn.