A Quick Overview of Voronoi Diagrams
If you've heard of Voronoi diagrams but don't klnow what they are, have a look at this quick and informative overview.
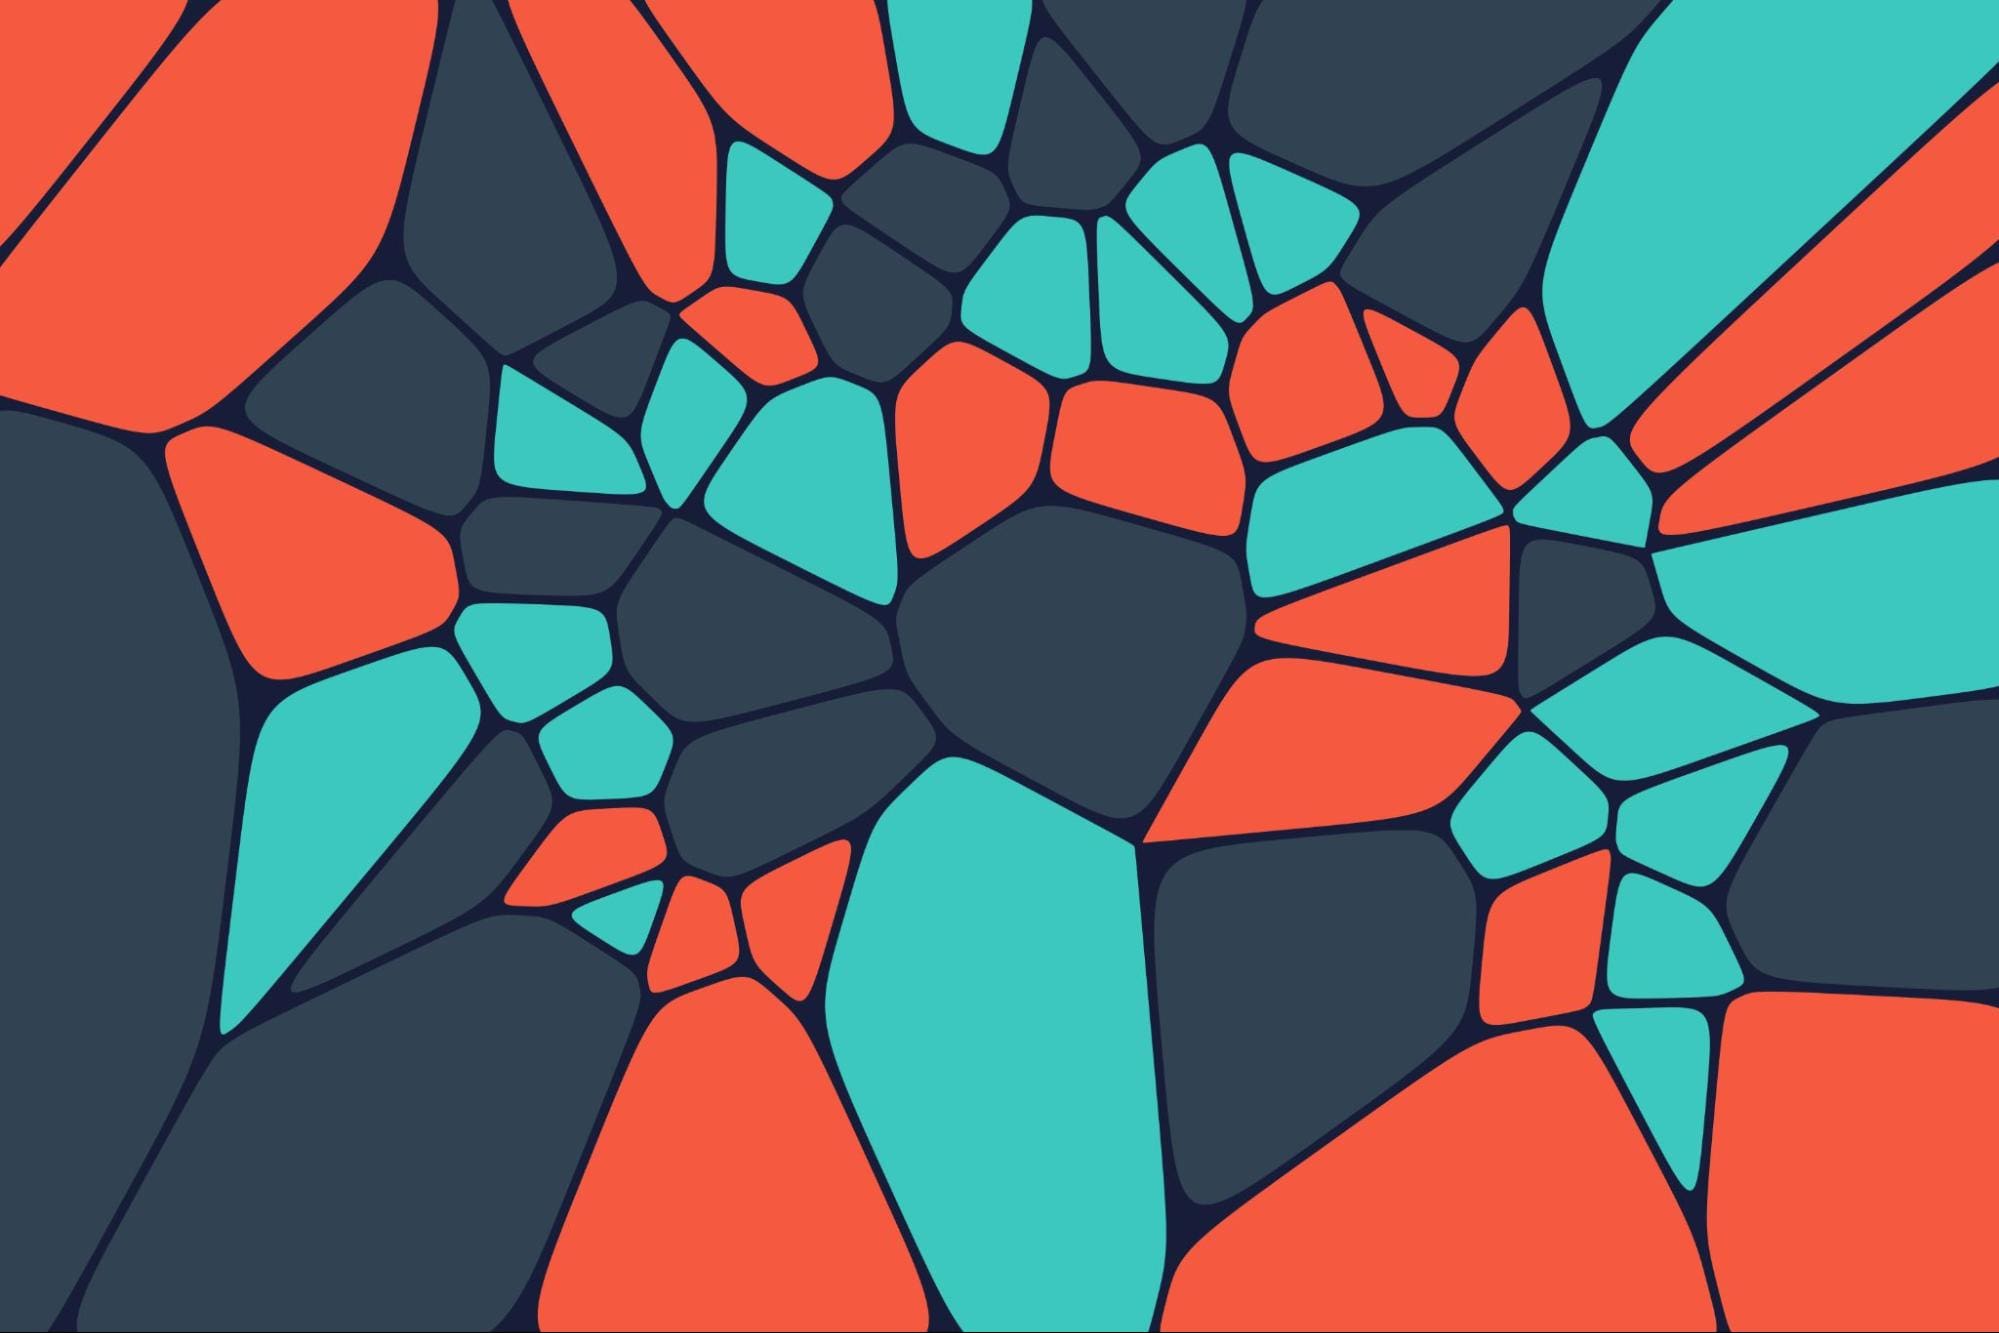
Vackground.com via Unsplash
Voronoi diagram. What’s that? It’s pretty much all around us, everywhere in nature. They are also known as Dirichlet tessellation or Thiessen polygons. Although they are referred to as such complex names, Voronoi diagrams are simple but have remarkable properties and attribute to different sectors, from computer science to art.
For example, in 1854 during the London cholera epidemic, physician John Snow used a Voronoi diagram of the location of water pumps in each polygon to identify a particular pump as the source of the infection to count deaths. Interesting right? So what is this diagram?
What is a Voronoi Diagram?
A Voronoi diagram is a type of diagram that has scattered random points (n) on a Euclidean plane. The plane is then divided up into cells around each point which encloses the portion of the plane that is the closest to each point - creating a tessellating polygon that covers the plane.
To get a better visual understanding, have a look at the image below. Each random point is enclosed in a cell that is equidistant between two or more points.
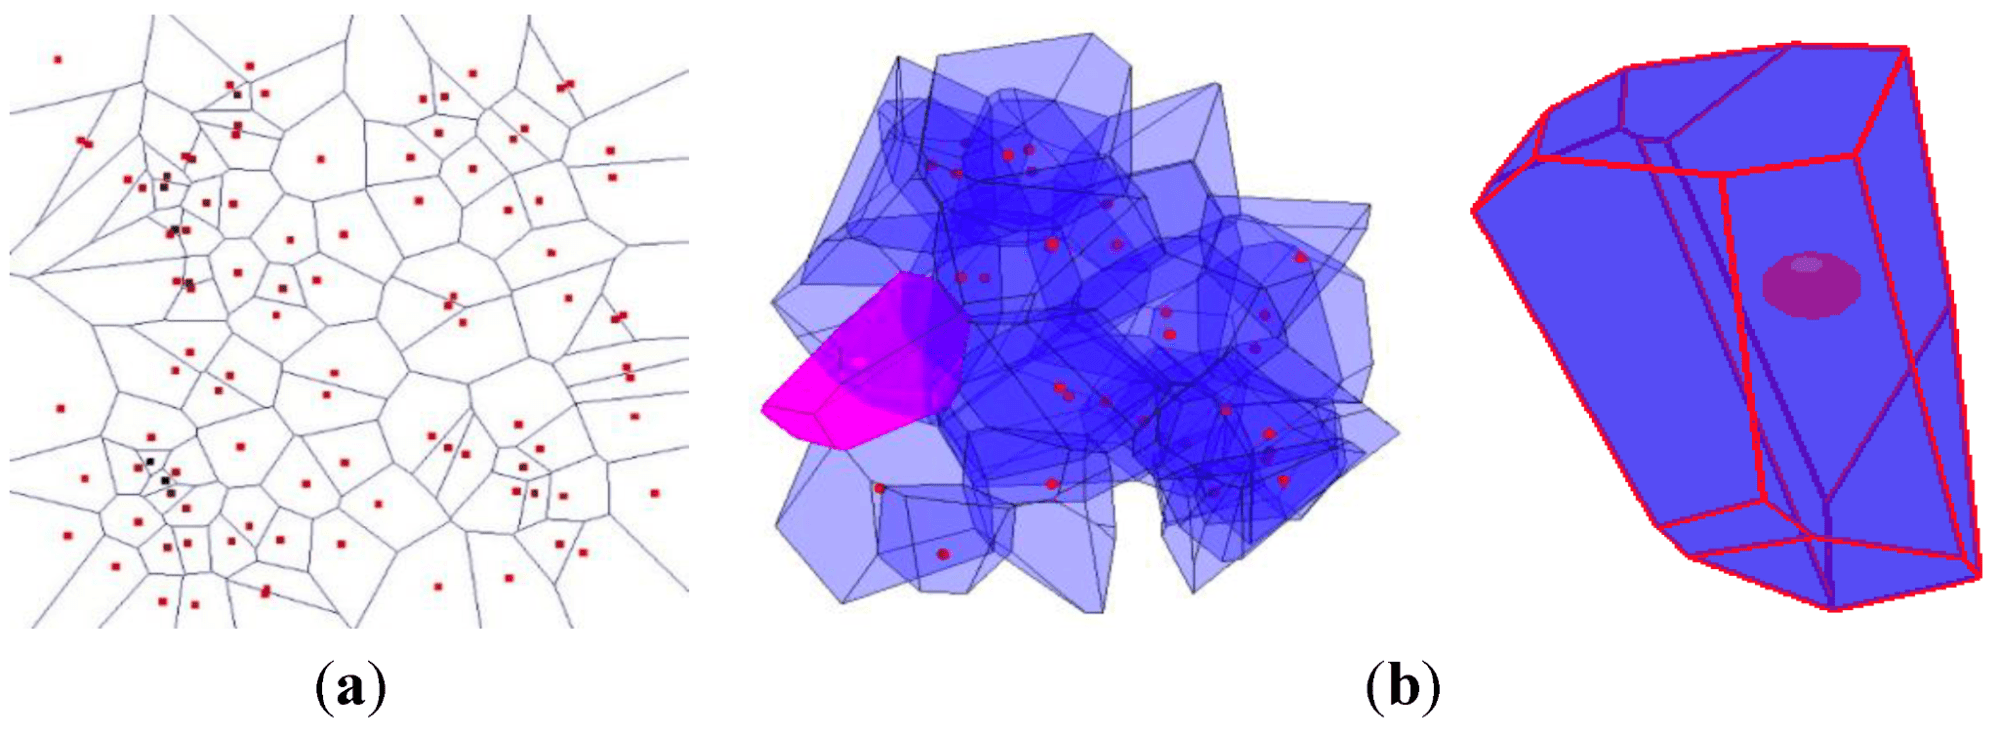
Source: MDPI
As you can see in the image above, in (a) the majority of the points are centered in the middle of each cell - but not all. The boundary of a cell is based on the distance to the points around it, in which the lines that are creating the cells divide the space between the points perfectly.
If more random points were added to a particular cell, they would be closest to the original point inside that cell.
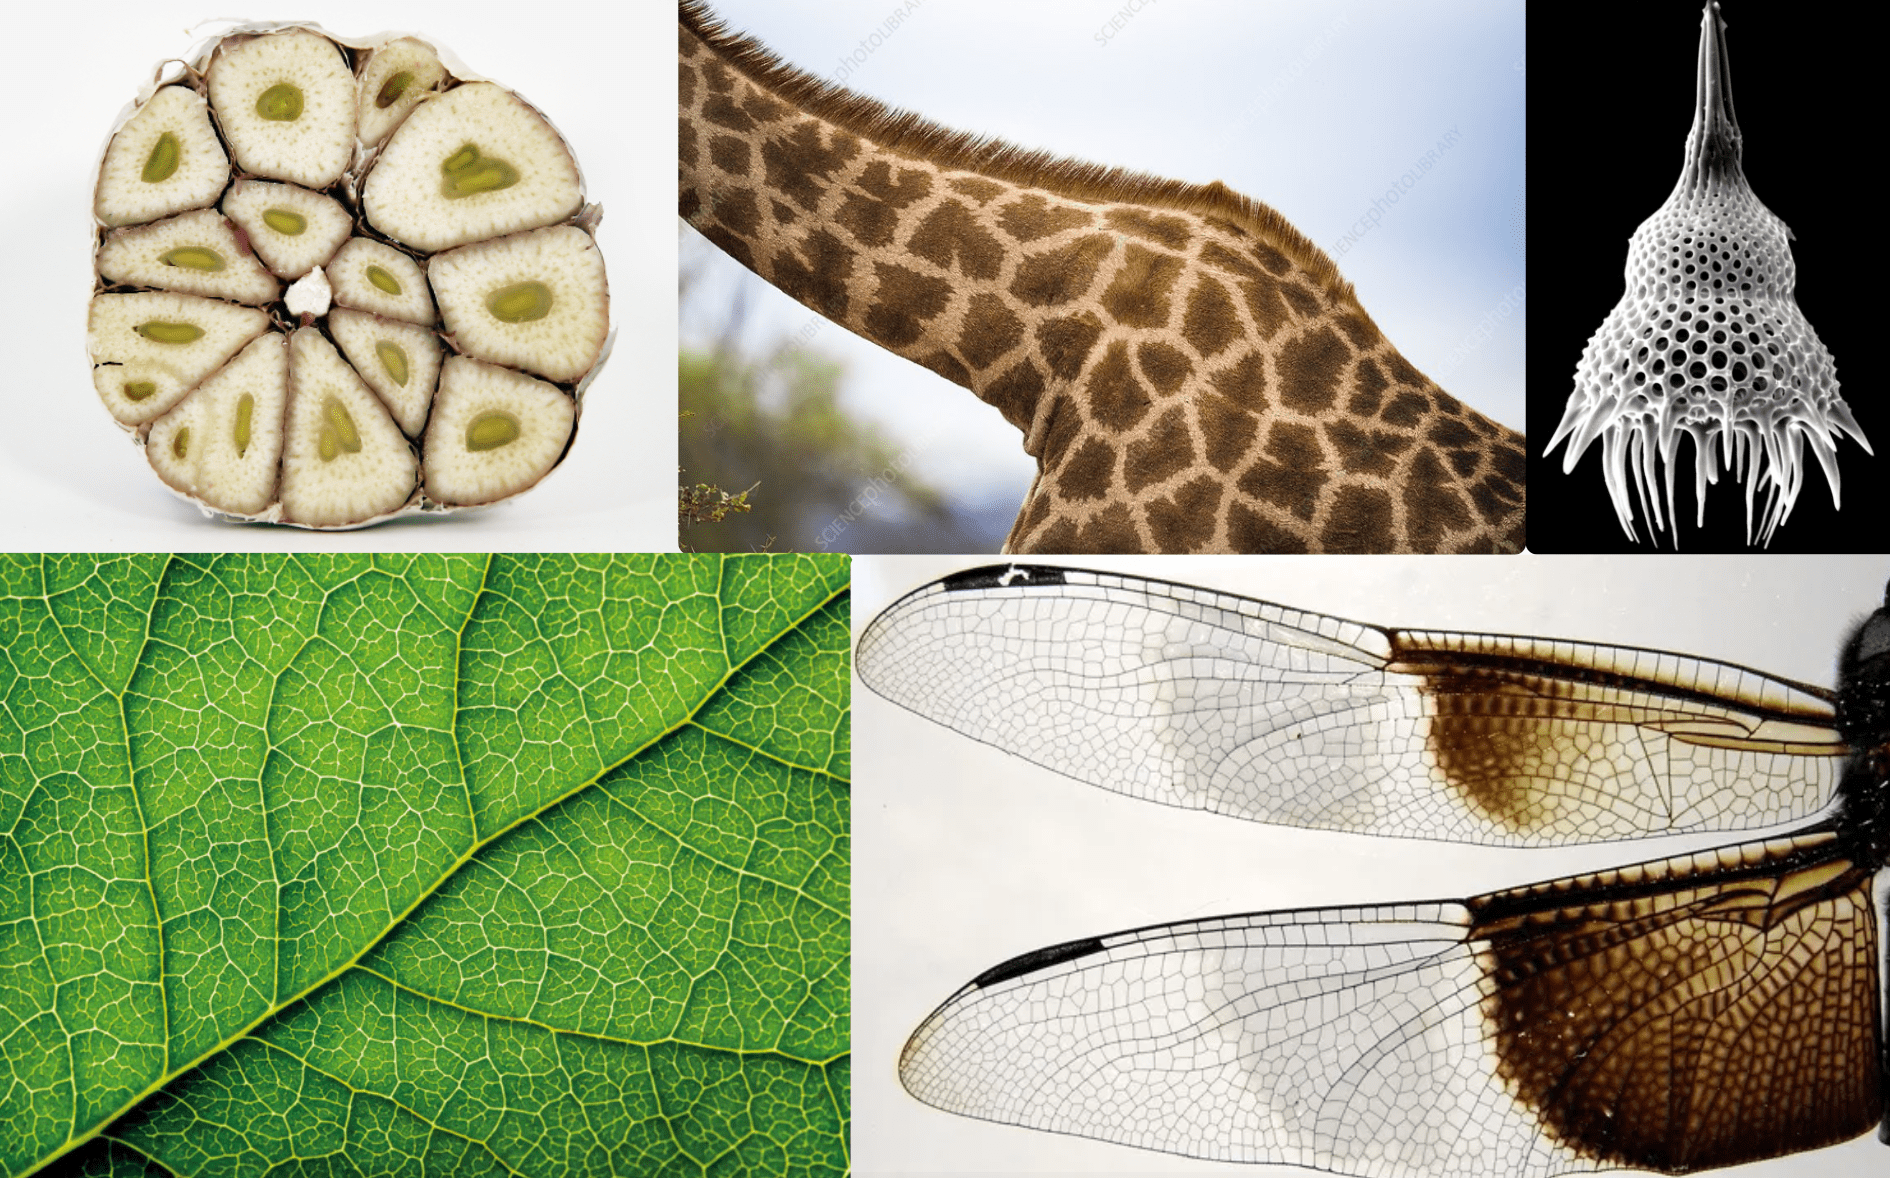
Voronoi diagrams have been seen and used in different cases - many of them coming from nature. I have put together a collage of naturally occurring Voronoi patterns to help give you a better understanding.
If you are interested in the shapes and patterns in animals, have a read of this paper: Integrating Shape and Pattern in Mammalian Models
Source: Author's Image
A Voronoi tessellation is created by the radial outward growth of the points, as shown in the figure below.
Source: Wikipedia
The Math Behind It
The distance between points can be measured using either:
Euclidean Distance

Manhattan Distance

If we were to plot Voronoi diagrams using 20 points on both of these metrics, they would look like this:
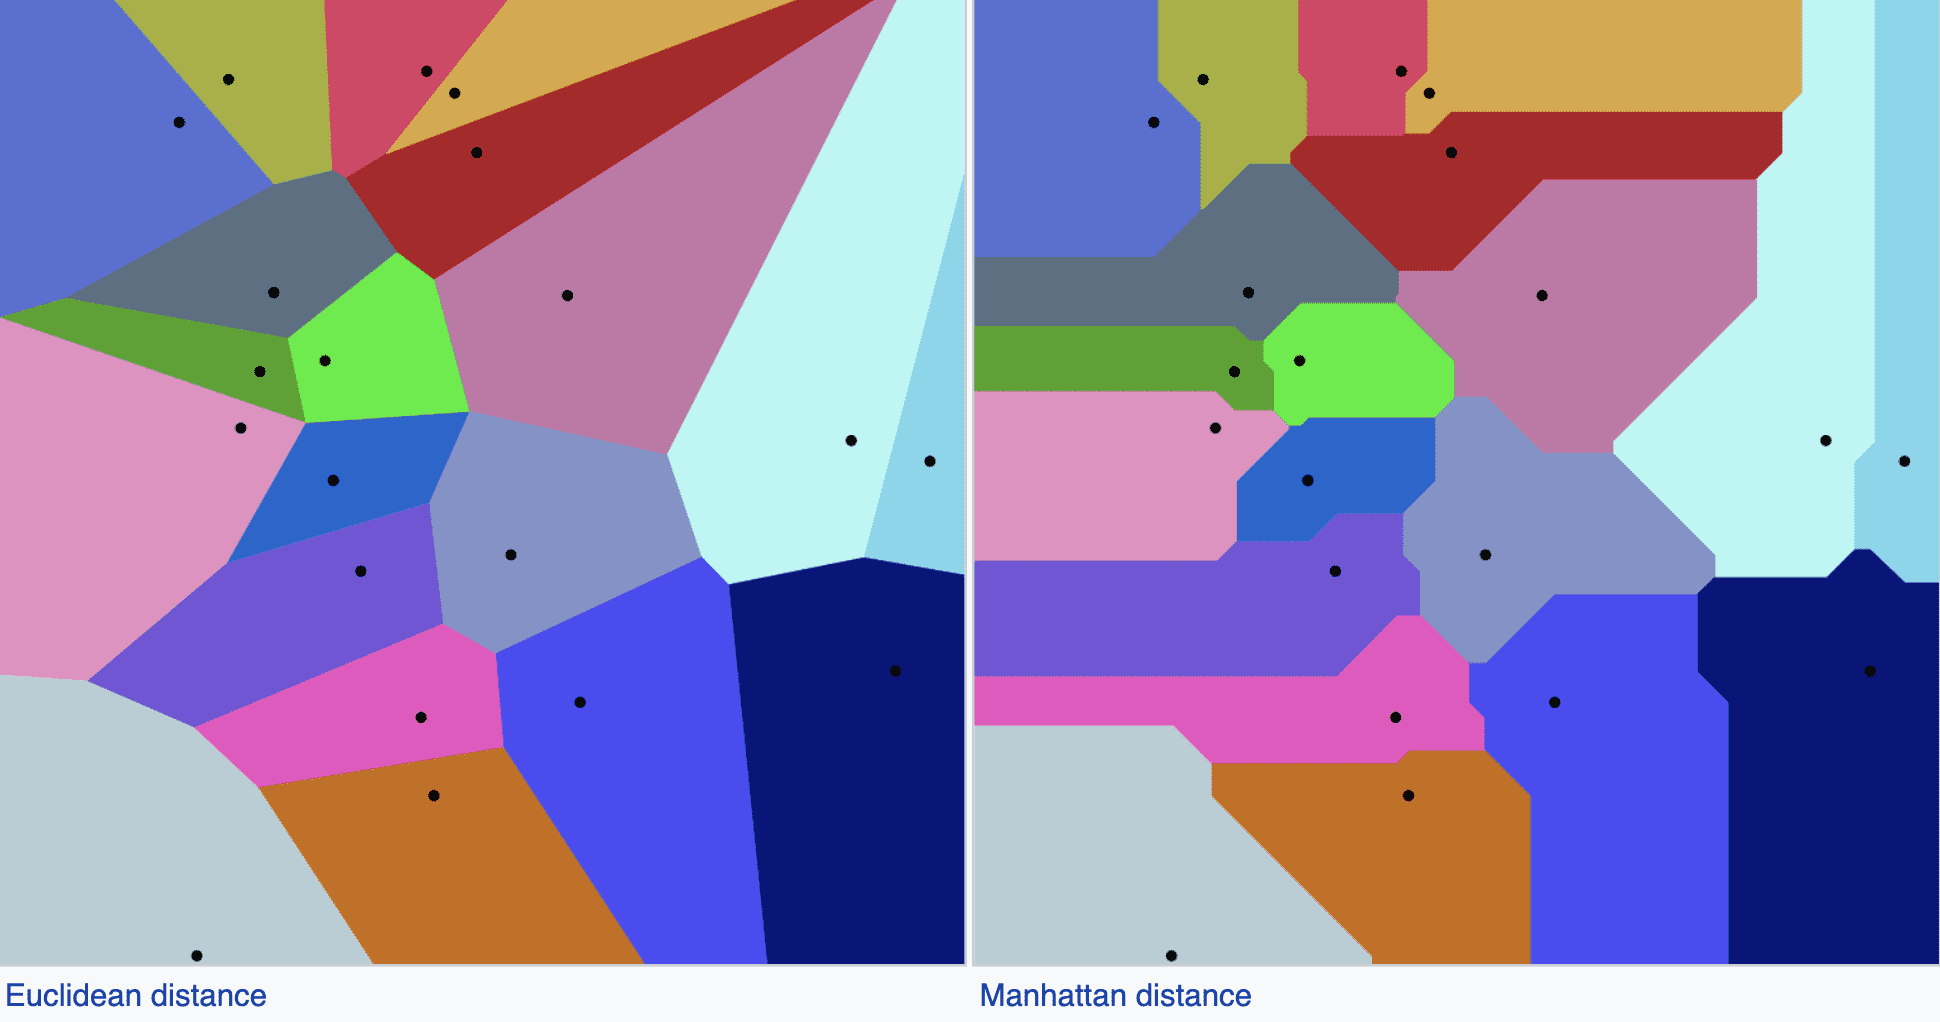
Source: Wikipedia
But all of this sounds very familiar, right? The distance between data points to find out more information. Sounds similar to K-nearest neighbors - an algorithm used to make predictions on the test data set by calculating the distance between the current training data points.
So how can we compute this?
Delaunay Triangulation
Delaunay triangulation sometimes also referred to as Delone triangulation is the triangulation formation of the nerve of the cells in a Voronoi diagram. To put this in a simpler form, if you were to take each point in a Voronoi diagram and link it to the point of its neighboring cells - and there you have it - you will have created a Delaunay triangulation.
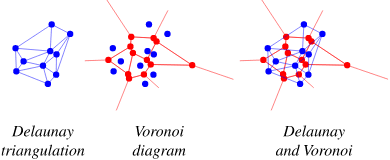
Source: mathworld
It is a collection of triangles using the original set of points based on one condition no triangle is allowed to lie inside the circumcircle of other triangles.
Lloyd's Algorithm
Lloyd's algorithm also known as Voronoi iteration generates a centroidal Voronoi tessellation. This means that the data point for each of the Voronoi cells is also referred to as the centroid. The algorithm repeatedly moves each point toward the centroid of the Voronoi cell and then re-partitions the input point according to its closest centroid. Just like k-means clustering.
Through each iteration, the algorithm will eventually space the points apart by creating more Voronoi-like cells.
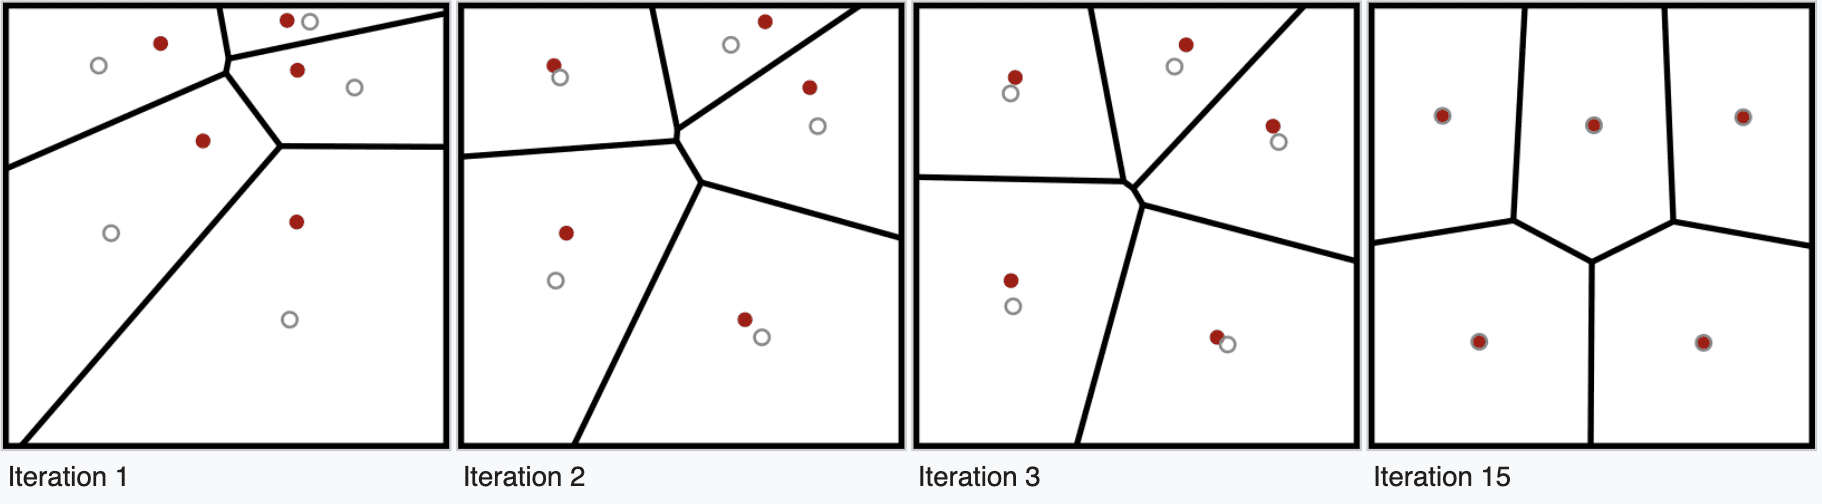
Source: Wikipedia
Wrapping Up
I hope this was a quick overview and understanding of Voronoi diagrams. It is used in many sectors and different cases. We were able to go over Voronoi diagrams, the math behind it, Delaunay triangulation, and Lloyd’s algorithm.
I hope this helped!
Nisha Arya is a Data Scientist and Freelance Technical Writer. She is particularly interested in providing Data Science career advice or tutorials and theory based knowledge around Data Science. She also wishes to explore the different ways Artificial Intelligence is/can benefit the longevity of human life. A keen learner, seeking to broaden her tech knowledge and writing skills, whilst helping guide others.