Motivation
Imagine you are trying to train a machine learning model to predict whether an ad is clicked by a particular person. After receiving some information about a person, the model predicts that a person will not click on an ad.
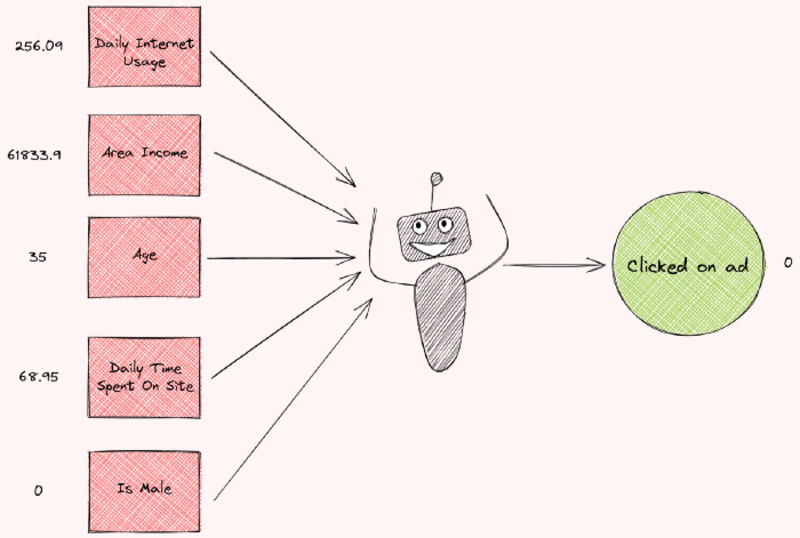
Image by Author
But why does the model predict that? How much does each feature contribute to the prediction? Wouldn’t it be nice if you can see a plot indicating how much each feature contributes to the prediction like below?
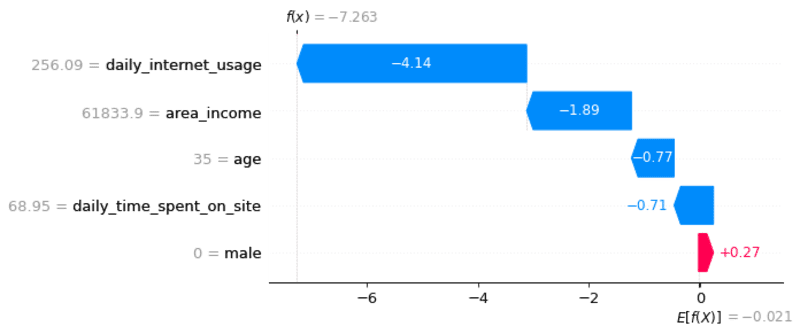
Image by Author
That is when Shapley value comes in handy.
What is Shapley Value?
The Shapley value is a method used in game theory that involves fairly distributing both gains and costs to actors working in a coalition.
Since each actor contributes differently to the coalition, the Shapley value makes sure that each actor gets a fair share depending on how much they contribute.

Image by Author
A Simple Example
Shapley value is used for a wide range of problems that question the contribution of each worker/feature in a group. To understand how Shapley value works, let’s imagine that your company has just done A/B testing, where they test different combinations of advertisement strategies.
The revenues for each strategy in a specific month are:
- no ad: $150
- social media: $300
- Google advertisement: $200
- email marketing: $350
- social media and Google advertisement $320
- social media and email marketing: $400
- Google advertisement and email marketing: $350
- email marketing, Google advertisement, and social media: $450
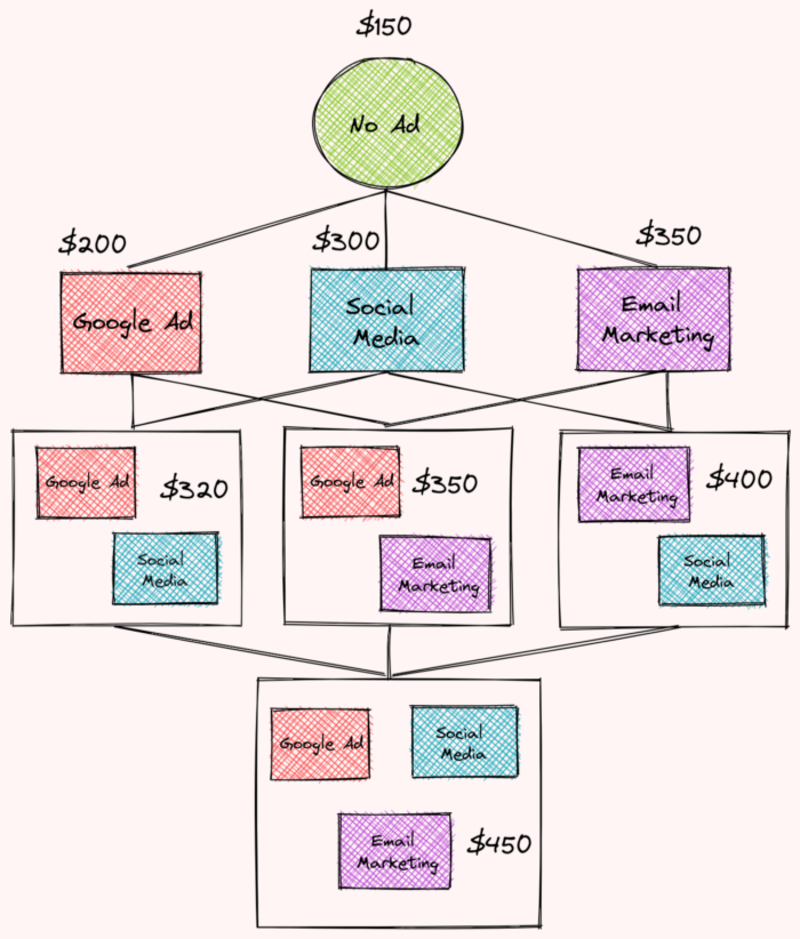
Image by Author
The difference in revenues between using three ads and using no ad is $300. How much does each ad contribute to this difference?
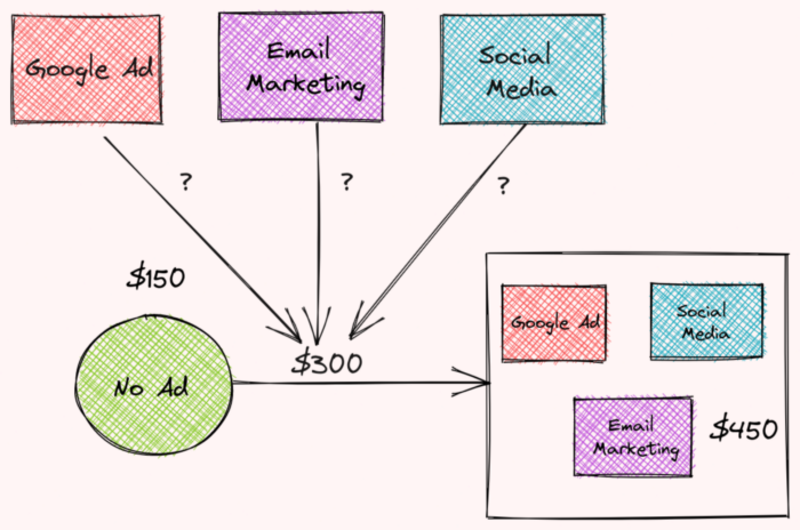
Image by Author
We can figure that out by calculating the Shapley value for each type of advertisement. This article provides an excellent way to calculate the Shap value. I will summarize it here.
We start by calculating the total contribution of Google advertisements to the company’s revenue. The total contribution of Google advertisement could be calculated by the formula:
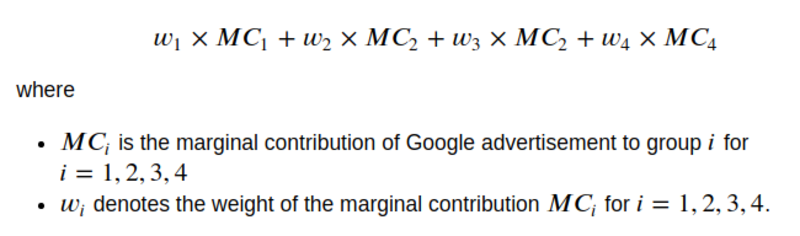
Image by Author
Let’s find the marginal contribution of Google advertisement and its weights.
Find Marginal Contribution of Google Advertisement
First, we will find the marginal contribution of Google advertisement to the following groups:
- no advertisement
- Google advertisement + social media
- Google advertisement + email marketing
- Google advertisement + email marketing + social media
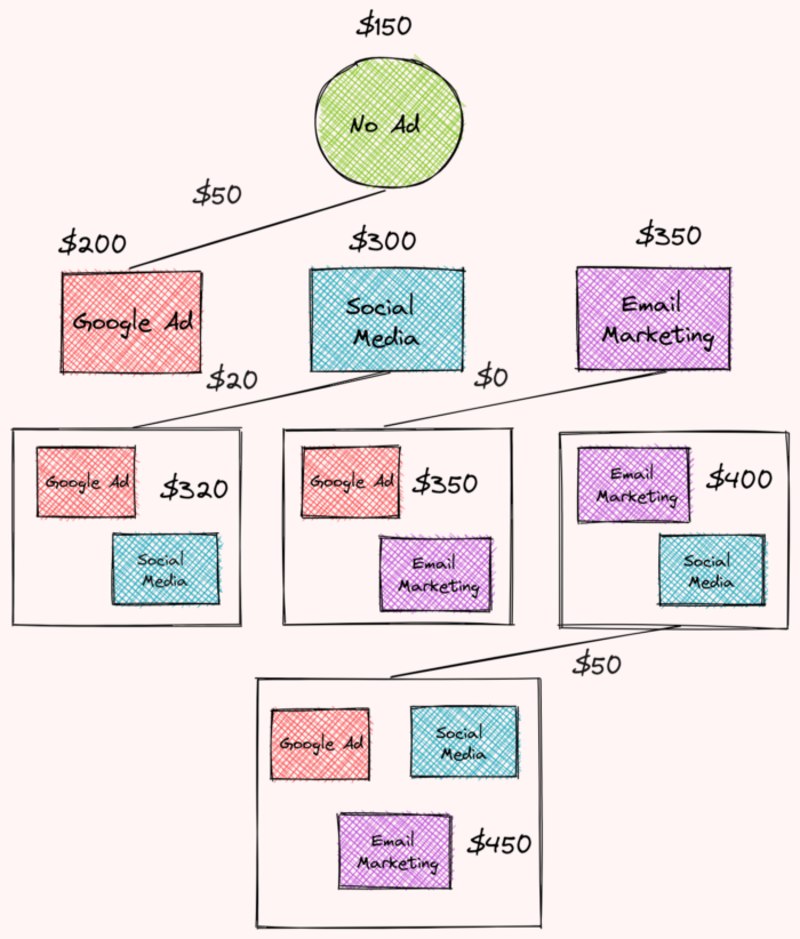
Image by Author
The marginal contribution of Google advertisement to no advertisement is:

Image by Author
The marginal contribution of Google advertisement to the Google advertisement and social media group is:
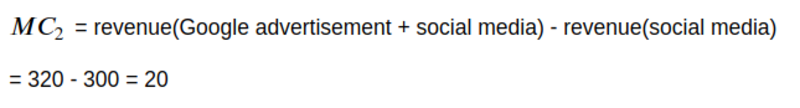
Image by Author
The marginal contribution of Google advertisement to the Google advertisement and email marketing group is:

Image by Author
The marginal contribution of Google advertisement to the Google advertisement, email marketing, and social media group is:
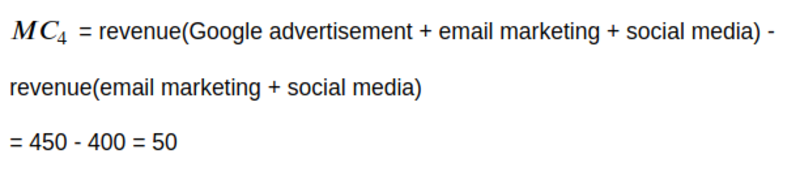
Image by Author
Find Weights
To find the weights, we will organize the combinations of different advertisement strategies into multiple levels like below. Each level corresponds to the number of advertisement strategies in each combination.
Then we will assign weights based on the number of edges in each level. We saw that:
- The first level contains 3 edges so the weight of each edge will be 1/3
- The second level contains 6 edges so the weight of each edge will be 1/6
- The third level contains 3 edges so the weight of each edge will be 1/3
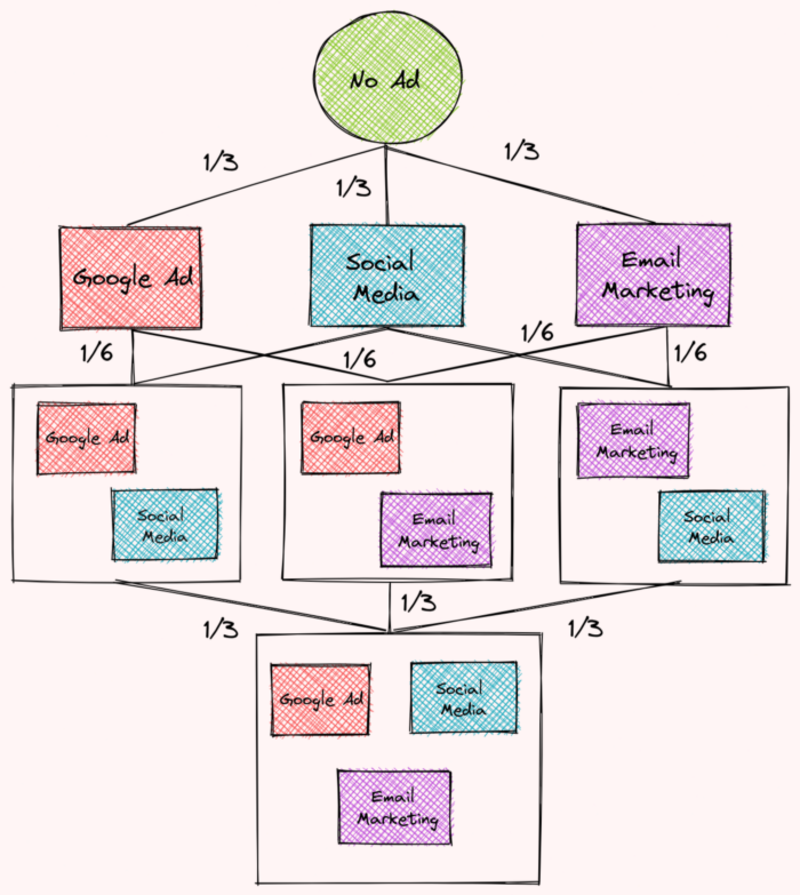
Image by Author
Find the Total Contribution of Google Advertisement
Now we are ready to find Google advertisement’s total contribution based on the weights and marginal contribution we found earlier!
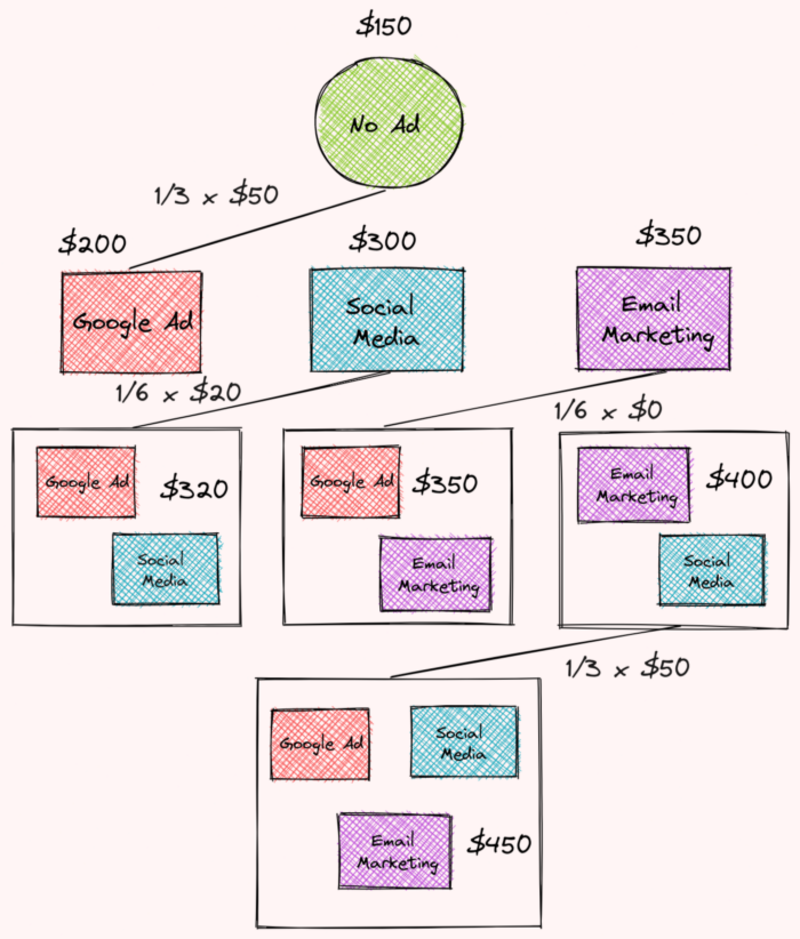
Image by Author
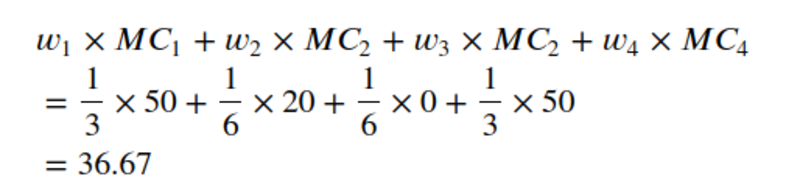
Image by Author
Cool! So Google advertisement contributes $36.67 to the total difference in revenues between using 3 advertisement strategies and using no advertisement. 36.67 is the Shapey value for Google advertisement.
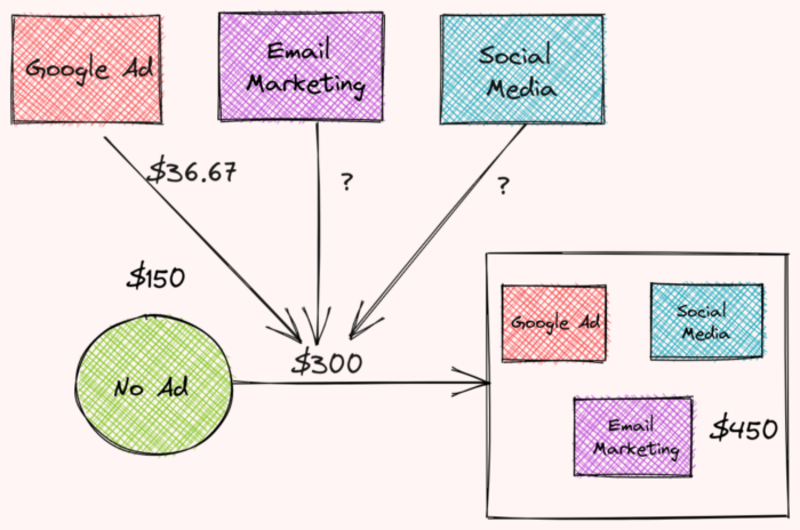
Image by Author
Repeat the steps above for two other advertisement strategies, we can see that:
- Email marketing contributes $151.67
- Social media contributes $111.67
- Google advertisement contributes $36.67
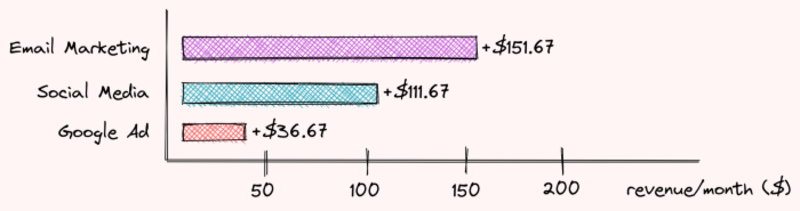
Image by Author
Together they contribute $300 to the difference between using 3 different types of advertisement and using no advertisement! Pretty cool, isn’t it?
Now that we understand the Shapley value, let’s see how we can use it to interpret a machine learning model.
SHAP — Explain Any Machine Learning Models in Python
SHAP is a Python library that uses Shapley values to explain the output of any machine learning model.
To install SHAP, type:
pip install shap
Train a Model
To understand how SHAP works, we will experiment with an advertising dataset:
We will build a machine learning model to predict whether a user clicked on an ad based on some information about that person.
We will use Patsy to turn the DataFrame into an array of features and an array of target values:
Split the data into train and test sets:
Next, we will use XGBoost to build a model and make predictions:
To see how well the model performs, we will use the F1 score:
0.9619047619047619
Pretty good!
Interpret the Model
The model did a good job of predicting whether a user clicked an ad. But how did it come up with such predictions? How much did each feature contribute to the difference between the final prediction and the average prediction?
Note that this problem is very similar to the problem we addressed at the beginning of the article.
That is why finding the Shapley value of each feature can help us determine their contribution. The steps to get the importance of the feature i, where i is the index of features, is similar to before:
- Get all subsets that don’t contain the feature i
- Find the marginal contribution of the feature i to each of these subsets
- Aggregate all marginal contributions to compute the contributions of the feature i
To find the Shapley values using SHAP, simply insert your trained model to shap.Explainer :
SHAP Waterfall Plot
Visualize the first prediction’s explanation:

Image by Author
Aha! Now we know the contribution of each feature to the first prediction. Explanations for the graph above:

Image by Author
- The blue bar shows how much a particular feature decreases the value of the prediction.
- The red bar shows how much a particular feature increases the value of the prediction.
- Negative values imply probabilities of less than 0.5 that the person clicked the ad
For each of these subsets, SHAP doesn’t remove a feature then retrain the model but replaces that feature with the average value of that feature, then generates the predictions.
We should expect the total contribution to be equal to the difference between the prediction and the mean prediction. Let’s check that:
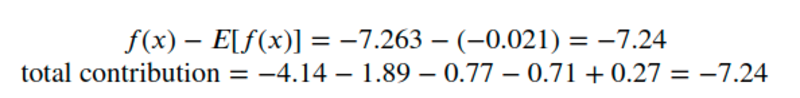
Image by Author
Cool! They’re equal.
Visualize the second prediction’s explanation:
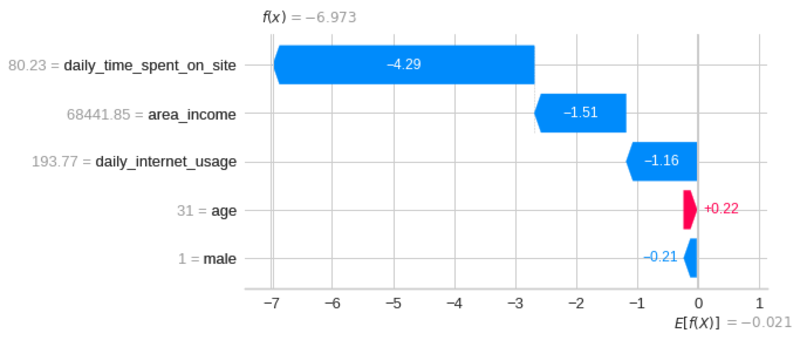
Image by Author
SHAP Summary Plot
Instead of looking at each individual instance, we can visualize the overall impact of these features across multiple instances using SHAP summary plot:
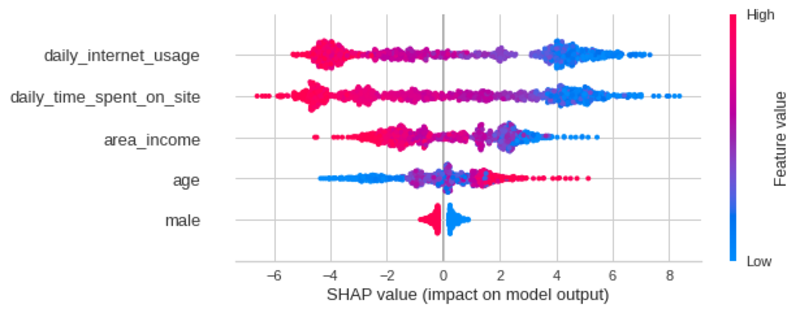
Image by Author
The SHAP summary plot tells us the most important features and their range of effects over the dataset.
From the plot above, we can gain some interesting insights into the model’s predictions:
- The daily internet usage of a user has the strongest effect on whether that user clicked on an ad.
- As the daily internet usage increases, a user is less likely to click on an ad.
- As the daily time spent on the site increases, a user is less likely to click on an ad.
- As the area income increases, a user is less likely to click on an ad.
- As the age increases, a user is more likely to click on an ad.
- If a user is a male, that user is less likely to click on an ad.
SHAP Bar Plot
We can also get a global feature importance plot using the SHAP bar plot.
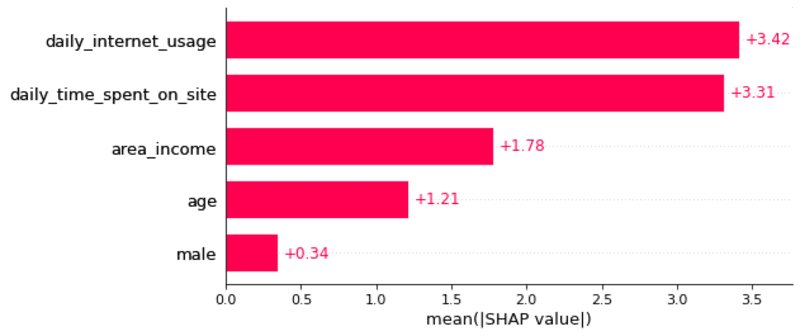
Image by Author
SHAP Dependence Scatter Plot
We can observe the effect of a single feature on all predictions made by the model using the SHAP dependence scatter plot.
Daily Internet Usage
Scatter plot of the daily internet usage feature:
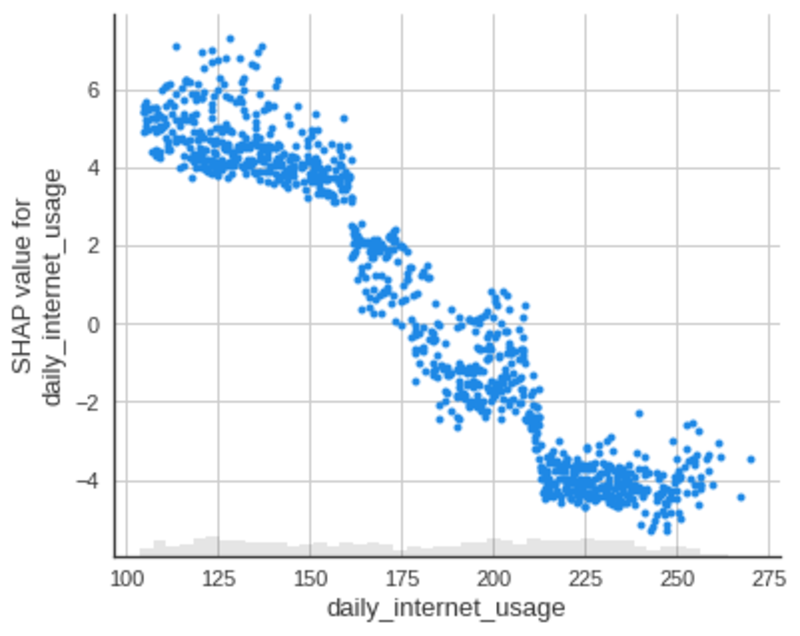
Image by Author
From the plot above, we can see that as the daily internet usage increases, the SHAP value for the daily internet usage decreases. This confirms what we saw in the earlier plot.
We can also observe the interaction between the daily internet usage feature with other features in the same plot by adding color=shap_values .
The scatter plot will attempt to pick out the feature column with the strongest interaction with daily internet usage, which is daily time spent on site.
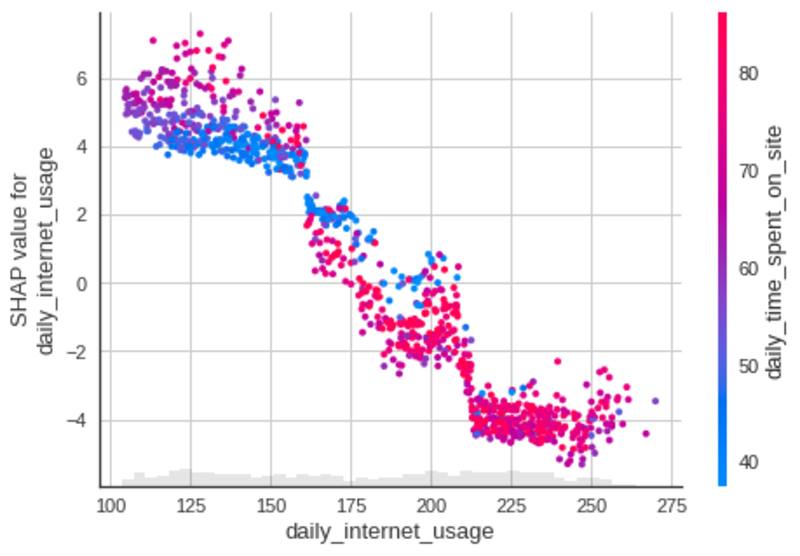
Image by Author
Cool! From the plot above, we can see that a person who uses the internet for 150 minutes per day and spends a small amount of time on the website per day is more likely to click the ad.
Let’s look at the scatter plots of some other features:
Daily Time Spent on Site

Image by Author
Area Income
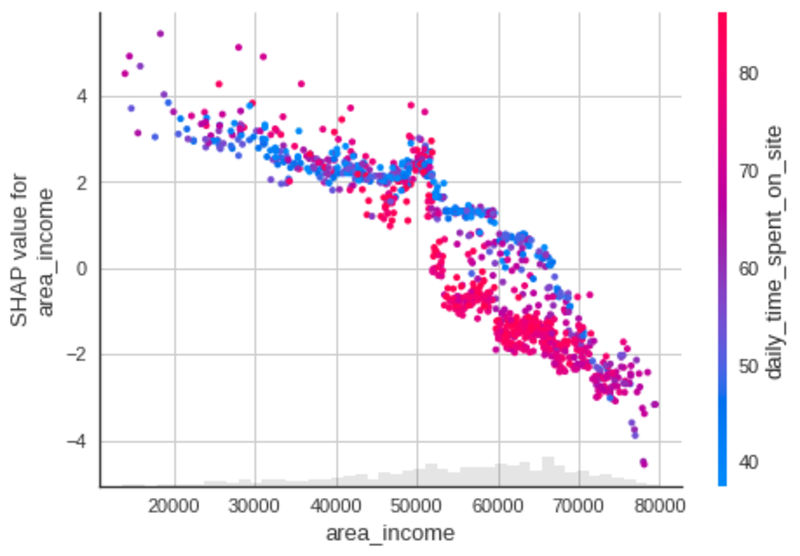
Image by Author
Age
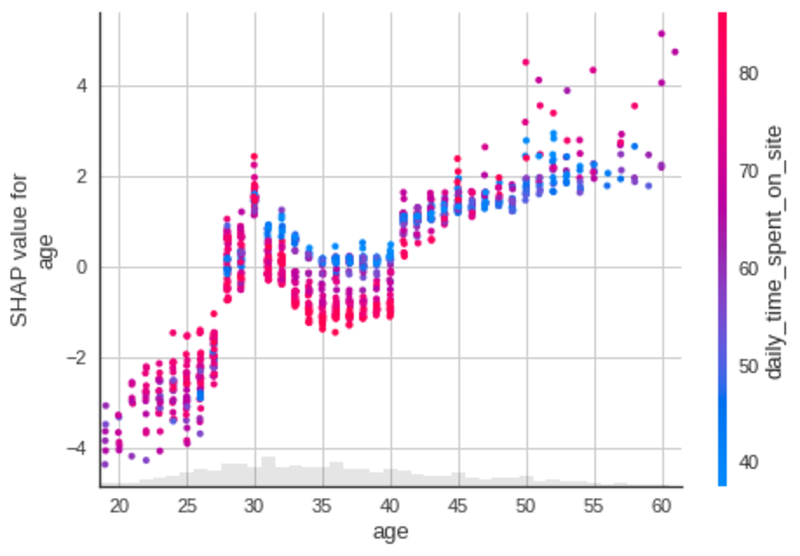
Image by Author
Gender

Image by Author
SHAP Interaction Plot
You can also observe the matrix of interactions between features with the SHAP interaction value summary plot. In this plot, the main effects are on the diagonal and the interaction effects are off the diagonal.

Image by Author
Pretty cool!
Conclusion
Congratulations! You have just learned about Shapey value and how to use it to interpret a machine learning model. I hope this article will give you the essential knowledge to interpret your own machine learning model using Python.
I recommend checking out SHAP’s documentation to learn more about other applications of SHAP.
Feel free to play with the source code in this interactive notebook or fork my repository.
Reference
Mazzanti, S. (2021, April 21). SHAP explained the way I wish someone explained it to me. Medium. Retrieved September 23, 2021, from https://towardsdatascience.com/shap-explained-the-way-i-wish-someone-explained-it-to-me-ab81cc69ef30.
Khuyen Tran is a prolific data science writer, and has written an impressive collection of useful data science topics along with code and articles. Khuyne is currently looking for a machine learning engineer role, a data scientist role, or a developer advocate role in Bay Area after May 2022, so please reach out if you are looking for someone with her set of skills.
Original. Reposted with permission.