Things Aren’t Always Normal: Some of the “Other” Distributions
Learn about Gamma, Beta, and Bernoulli distributions with Python.

Image Source: Unsplash
Key Takeaways
Probability distributions play an important role in data science and statistics. Even though the normal (Gaussian) distribution is the most popular probability distribution, other probability distributions could also be used in data science:
- The Gamma distribution is used to model continuous variables that represent time intervals between events
- The Beta distribution is used to model continuous variables that represent proportions or probabilities
- The Bernoulli distribution is used to model binary outcomes
Probability distributions are mathematical functions that describe the behavior of random variables. In data science and machine learning, probability distributions are often used to describe the underlying distribution of a dataset, to make predictions about future events, and to evaluate the performance of machine learning models. For example, the Gaussian distribution is a parametric distribution that depends on two variables, the mean and standard deviation. Hence, once the mean and standard deviation parameters are known, a dataset that is normally distributed can be created. As an example, the code below creates a dataset containing 1000 values that are normally distributed with a mean of 0 and a standard deviation of 0.1.
import numpy as np

import matplotlib.pyplot as plt

mu, sigma = 0, 0.1 # mean and standard deviation

s = np.random.normal(mu, sigma, 1000)

count, bins, ignored = plt.hist(s, 30, density = True)
plt.plot(bins, 1/(sigma * np.sqrt(2 * np.pi)) *
               np.exp( - (bins - mu)**2 / (2 * sigma**2) ),
         linewidth=2, color='r')
plt.show()
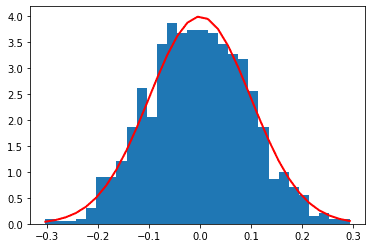
Fig 1. Visualization of Gaussian distribution.
We can also plot normal distributions for different combinations of the mean and standard deviation, as shown below:
import numpy as np
import scipy.stats as stats
import matplotlib.pyplot as plt

#define three Gamma distributions
x = np.linspace(-10, 10, 101)
y1 = stats.norm.pdf(x, 0, 2)
y2 = stats.norm.pdf(x, 0, 4)
y3 = stats.norm.pdf(x, 2, 2)

#add lines for each distribution
plt.plot(x, y1, label='mu=0, sigma=2')
plt.plot(x, y2, label='mu=0, sigma=4')
plt.plot(x, y3, label='mu=4, sigma=1')

#add legend
plt.legend()

#display plot
plt.show()
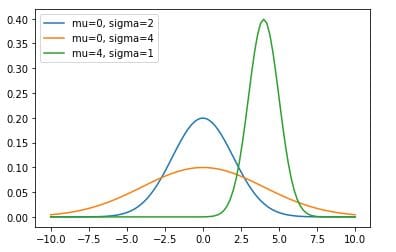
Fig 2. Visualization of Gaussian distribution for different mean and standard deviations.
Probability distributions are important in data science and machine learning because they provide a way to quantify and analyze uncertainty, which is an inherent part of many real-world processes. They also play a key role in statistical inference, which is the process of using data to make inferences about a population or process.
In this article, we will explain three probability distributions for machine learning, namely the Gamma distribution, Beta distribution, and Bernoulli distribution.
Gamma Distribution
The Gamma distribution is a continuous probability distribution that is often used to model the time between events in a process that occurs at a constant rate. It is characterized by a shape parameter (k) and a rate parameter (ϴ), and its PDF (probability density function) is defined as
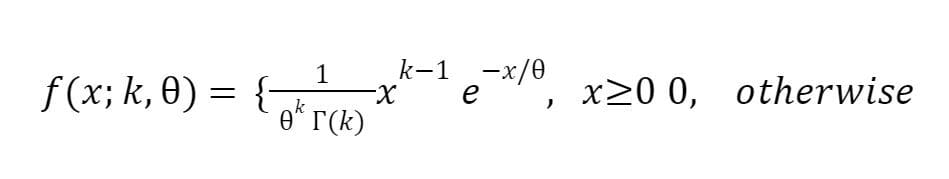
where Γ(k) is the gamma function, ϴ is the scale parameter, and k is the shape parameter.
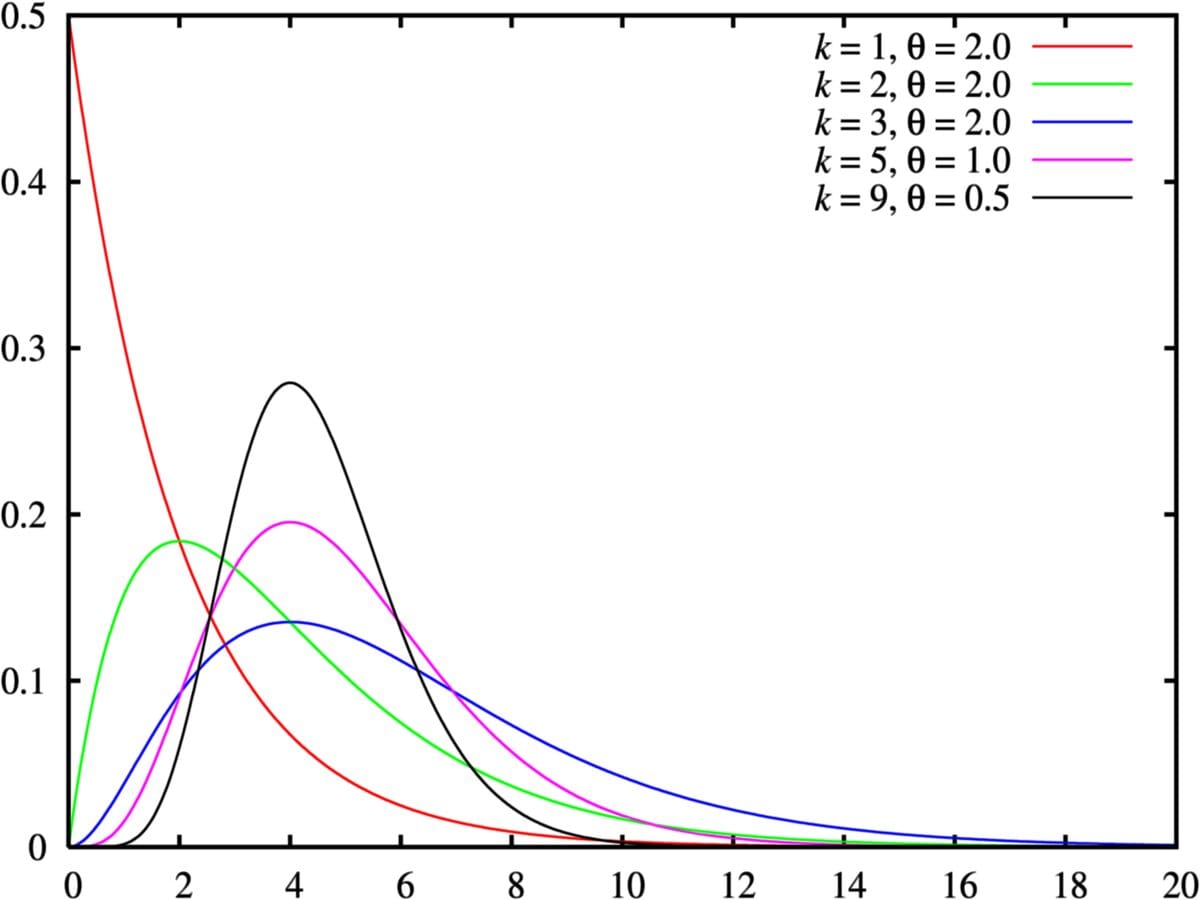
Fig 3. Visualization of Gamma distribution.
The Gamma distribution is often used to model the distribution of continuous variables that represent time intervals between events. For example, it could be used to model the time between the arrival of customers at a store, or the time between failures of a piece of equipment.
Code Example: In Python, the Gamma distribution can be generated using the "gamma" function from the scipy.stats module. For example, the code below will generate a random variable x with a Gamma distribution and plot the probability density function of the distribution. The k and theta parameters specify the shape and rate parameters of the Gamma distribution, respectively.
import numpy as np
import scipy.stats as stats
import matplotlib.pyplot as plt

#define three Gamma distributions
x = np.linspace(0, 40, 100)
y1 = stats.gamma.pdf(x, a=5, scale=3)
y2 = stats.gamma.pdf(x, a=2, scale=5)
y3 = stats.gamma.pdf(x, a=4, scale=2)

#add lines for each distribution
plt.plot(x, y1, label='shape=5, scale=3')
plt.plot(x, y2, label='shape=2, scale=5')
plt.plot(x, y3, label='shape=4, scale=2')

#add legend
plt.legend()

#display plot
plt.show()
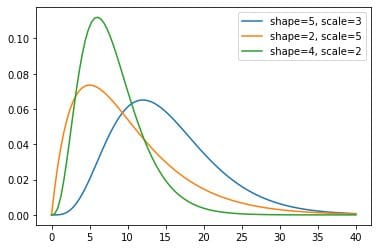
Fig 4. Visualization of Gamma distribution for different shape and scale parameters.
In addition to generating random variables, the scipy.stats module also provides functions for estimating the parameters of the Gamma distribution from data, testing for the goodness of fit, and performing statistical tests using the Gamma distribution. These functions can be useful for analyzing data that is believed to follow a Gamma distribution.
Beta Distribution
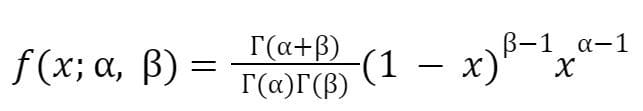
The Beta distribution is a continuous probability distribution that is defined on the interval [0, 1]. It is often used to model proportions or probabilities, and it is characterized by two shape parameters, which are usually denoted as α and β. The PDF of the Beta distribution is defined as
The PDF can also be expressed
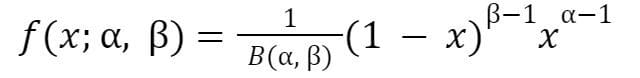
where
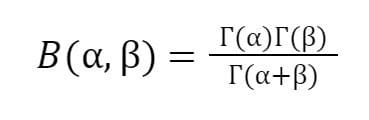
is the beta function.
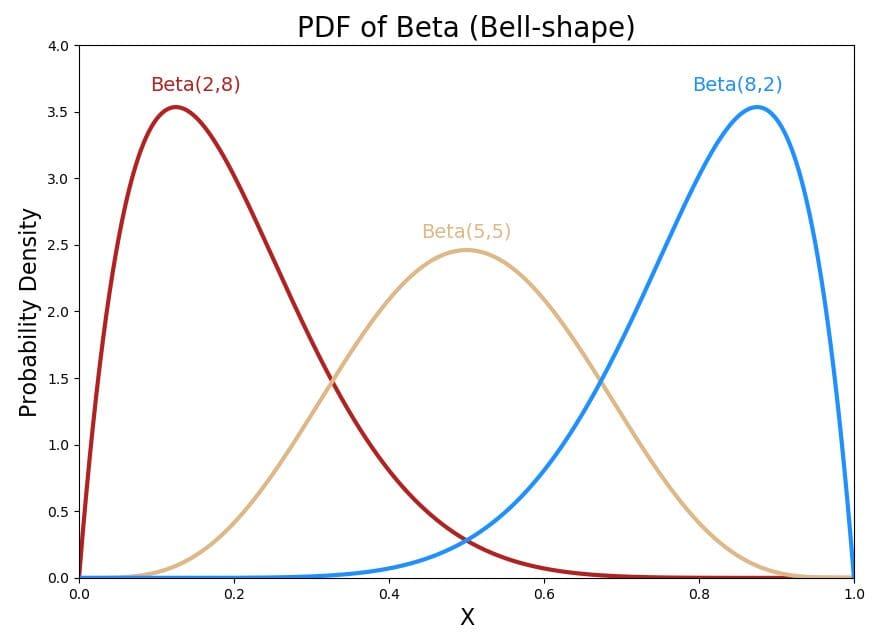
Fig 5. Visualization of Beta distribution.
The Beta distribution is often used to model the distribution of continuous variables that represent proportions or probabilities. For example, it could be used to model the probability of a customer making a purchase given certain marketing efforts, or the probability of a machine learning model making a correct prediction.
Code Example: In Python, the Beta distribution can be generated using the "beta" function from the scipy.stats module. For example
import numpy as np
import matplotlib.pyplot as plt
from scipy.stats import beta

# Set the shape paremeters
a, b = 80, 10

# Generate the value between
x = np.linspace(beta.ppf(0.01, a, b),beta.ppf(0.99, a, b), 100)

# Plot the beta distribution
plt.figure(figsize=(7,7))
plt.xlim(0.7, 1)
plt.plot(x, beta.pdf(x, a, b), 'r-')
plt.title('Beta Distribution', fontsize='15')
plt.xlabel('Values of Random Variable X (0, 1)', fontsize='15')
plt.ylabel('Probability', fontsize='15')
plt.show()
This will generate a random variable x with a Beta distribution and plot the probability density function of the distribution. The a and b parameters specify the shape parameters of the Beta distribution, respectively.
The scipy.stats module has functions for estimating the Beta distribution's parameters from data, evaluating the goodness of fit, and running statistical tests using the Beta distribution, in addition to producing random variables.
Bernoulli Distribution
The Bernoulli distribution is a discrete probability distribution that describes the outcome of a single binary event, such as a coin flip. It is characterized by a single parameter, p, which is the probability of the event occurring. The probability mass function of the Bernoulli distribution is defined as
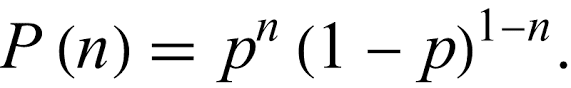
where n is either 0 or 1, representing the outcome of the event.
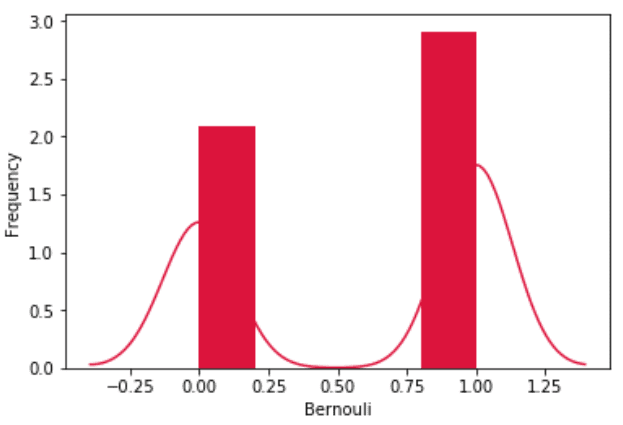
Fig 6. Visualization of Bernoulli distribution.
This distribution is often used to model the probability of a binary outcome, such as the probability of a customer making a purchase or the probability of a machine learning model making a correct prediction.
Code Example: In Python, the Bernoulli distribution can be generated using the "Bernoulli" function from the scipy.stats module. For example:
from scipy.stats import bernoulli
import seaborn as sb

data_bern = bernoulli.rvs(size=1000,p=0.6)
ax = sb.distplot(data_bern,
                  kde=True,
                  color='crimson',
                  hist_kws={"linewidth": 25,'alpha':1})
ax.set(xlabel='Bernouli', ylabel='Frequency')
This will generate a random variable x with a Bernoulli distribution and plot the probability mass function of the distribution. The p parameter specifies the probability of the event occurring.
In addition to generating random variables, the scipy.stats module also provides functions for estimating the probability parameter of the Bernoulli distribution from data, testing for the goodness of fit, and performing statistical tests using the Bernoulli distribution. When evaluating data that is thought to follow a Bernoulli distribution, these functions can be helpful.
In summary, the Gamma distribution is used to model continuous variables that represent time intervals between events, the Beta distribution is used to model continuous variables that represent proportions or probabilities, and the Bernoulli distribution is used to model binary outcomes. Knowing the concepts behind these probability distributions is helpful in your machine-learning journey, as they help you model solutions to a wide variety of problems in data science and machine learning.
Benjamin O. Tayo is a Physicist, Data Science Educator, and Writer, as well as the Owner of DataScienceHub. Previously, Benjamin was teaching Engineering and Physics at U. of Central Oklahoma, Grand Canyon U., and Pittsburgh State U.