A Beginner’s Guide to Anomaly Detection Techniques in Data Science
In this article, I will give you a brief introduction to anomaly detection and I will guide you through the different techniques that you can use to identify anomalies.
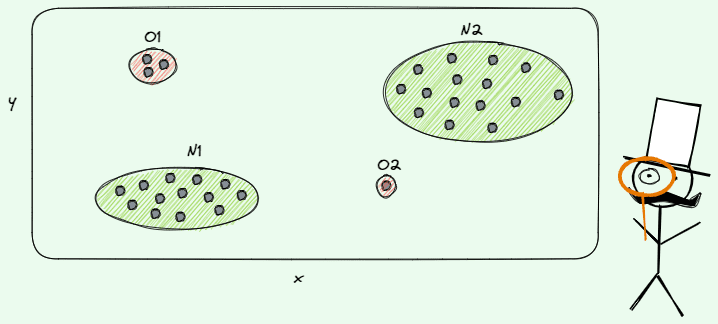
Image by Author
Anomaly Detection is a very important task that you can meet or you’ll meet in the future eventually if you are dealing with data. It’s very applied in many fields, like manufacturing, finance and cybersecurity.
Getting started with this topic for the first time can be challenging by yourself without a guide that orients you step by step. In my first experience as a data scientist, I remember that I struggled a lot to be able to master this discipline.
First of all, Anomaly Detection involves the identification of rare observations with values that deviate drastically from the rest of the data points. These anomalies, often called outliers, are a minority, while most of the items belong to the normal class. This means that we are dealing with an imbalanced dataset.
Another challenge is that most of the time there is no labelled data when working in the industry and it’s challenging to interpret the predictions without any target. This means that you can’t use evaluation metrics typically used for classification models and you need to undertake other methods to interpret and trust the output of your model. Let’s get started!
What is Anomaly Detection?
Anomaly detection refers to the problem of finding patterns in data that do not conform to expected behavior. These nonconforming patterns are often referred to as anomalies, outliers, discordant observations, exceptions, aberrations, surprises, peculiarities, or contaminants in different application domains. Credit Anomaly Detection: A Survey
This is a good definition of anomaly detection in a few words. Anomalies are often associated with errors obtained during data collection and, then, they finish to be eliminated. But there are also cases when there are new items with a completely different variability compared to the rest of the data and there is a need for appropriate approaches to recognize this type of observation. The identification of these observations can be very useful for making decisions in companies operating in many sectors, such as finance and manufacturing.
What are the Types of Anomalies?
There are three main types of anomalies: point anomalies, contextual anomalies and collective anomalies.
Example of point anomaly. Illustration by Author.
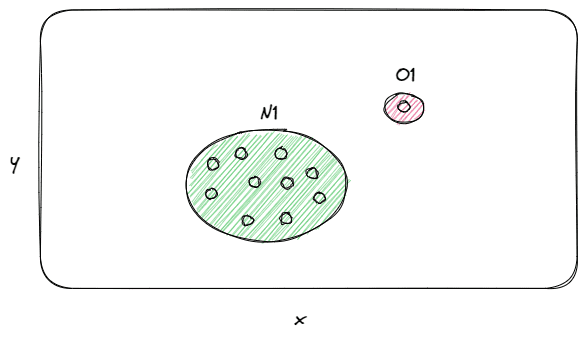
As you may deduce, point anomalies constitute the simplest case. It happens when a single observation is anomalous compared to the rest of the data, so it’s identified as an outlier/anomaly. For example, let’s suppose that we want to make credit card fraud detection in the transactions of clients in a bank. In that case, a point anomaly can be considered a fraudulent activity of a client.

Example of contextual anomaly. Credit EPA. Modified by Author.
Another case of anomaly can be a contextual anomaly. You can meet this type of anomaly only in a specific context. An example can be the summer heat waves in the United States. You can notice that there is a huge spike in 1930, which represents an extreme event that happened in the United States, called Dust Bowl. It’s called that way because it was a period of dust storms that damaged the south-central United States.
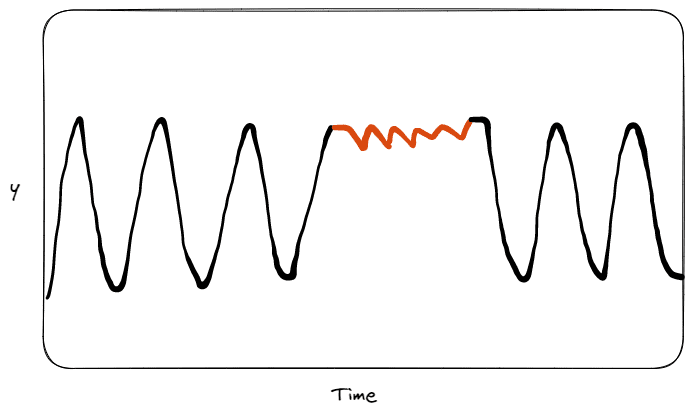
Example of collective anomaly. Illustration by Author.
The third and last type of anomaly is the collective anomaly. The most intuitive example is to think about the absence of precipitations we are having this year from months in Italy. If we compare the data in the last 50 years, there haven’t ever been similar behaviours. The single data instances in an anomalous collective may not be identified as outliers by themselves, but all these data points together indicate a collective anomaly. In this context, a single day without precipitation is not anomalous by itself, while a lot of days without precipitation can be considered anomalous compared to the data of previous years.
What Machine Learning Models can be used for Anomaly Detection?
There are several approaches that can be applied to anomaly detection:
- Isolation Forest is an unsupervised and non-parametric technique introduced by Fey Tony Liu in 2012. Like the random forest, it’s an ensemble learning method that trains decision trees in a parallel way. But differently from other ensemble methods, it is specialized in isolating the anomalies from the rest of the items. The assumptions behind this approach constitute the reason for the effectiveness of this approach: (1) the anomalies are part of a minority class compared to the normal data which are more numerous; (2) the anomalies tend to be found fastly with the shortest average path.
- Local Outlier Factor is a density-based clustering algorithm proposed by Markus M. Breuningin 2000, that detects anomalies by calculating the local density deviation of a specific item with respect to its neighbours. It assumes that the density around an anomaly should be significantly different from the density around its neighbours. Moreover, the outliers should have lower density.
- Autoencoder is an unsupervised model composed of two neural networks, an encoder and a decoder. During training, only normal data is passed to the model. In this way, it learns the compressed representation of normal data, which is supposed to be different from the representation of outliers. There is also the assumption that anomalous data shouldn’t be reconstructed well by the model since it’s completely different from normal data and, then, it should have a higher reconstruction error.
How can I Evaluate an Anomaly Detection Model in an Unsupervised Setting?
In an unsupervised setting, there are no evaluation metrics that can help you to understand the rate of correct positive predictions (precision) or the rate of the actual positives (recall).
Without any possibility of evaluating the performance of the model, it’s more important than ever to provide an explanation of model predictions. This can be achieved by using interpretability approaches, like SHAP and LIME.
There are two possible interpretations: global and local. The aim of global interpretability is to provide explanations of the model as a whole, while the local interpretability aims at explaining the model prediction of a single instance.
Final Thoughts
I hope you found useful this fast overview of anomaly detection techniques. As you have noticed, it’s a challenging problem to solve and the suitable technique changes depending on the context. I also should highlight that it’s important to make some explorative analysis before applying any anomaly detection model, like PCA to visualize the data in a lower dimensional space and boxplots. If you want to go deeper, check the resources below. Thanks for reading! Have a nice day!
Resources
- Anomaly Detection: A Survey by V. Chandola
- Isolation Forest’s paper
- Paper Review: Reconstruction by inpainting for visual anomaly detection
- SHAP’s paper
- LIME’s paper
Eugenia Anello is currently a research fellow at the Department of Information Engineering of the University of Padova, Italy. Her research project is focused on Continual Learning combined with Anomaly Detection.