Practical Statistics for Data Scientists
Check out these essential statistical concepts for data science.

Image by unsplash
Statistical concepts are used widely to extract useful information from data. This article will review essential statistical concepts applicable in data science and machine learning.
Probability Distribution
A probability distribution shows how feature values are distributed around the mean value. Using the iris dataset, the probability distributions for the sepal length, sepal width, petal length, and petal width can be generated using the code below.
import numpy as np
import matplotlib.pyplot as plt
from sklearn import datasets
import seaborn as sns

iris = sns.load_dataset("iris")
sns.kdeplot(data=iris)
plt.show()
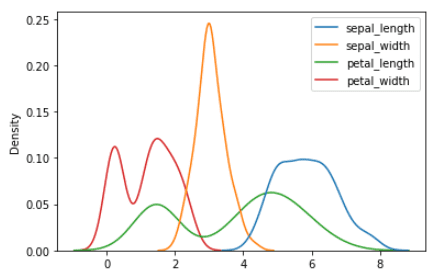
Probability distribution of sepal length, sepal width, sepal width, petal length, and petal width | Image by Author
Mode
Lets now focus on the sepal length variable. The probability distribution of the sepal length variable is shown below.
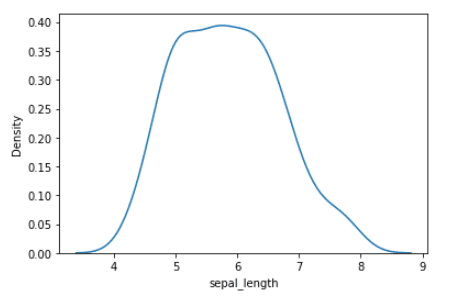
Probability distribution of sepal length variable | Image by Author
We observe that the probability distribution of the sepal length variable has a single maximum, hence it is unimodal. The value of the sepal length where the maximum occurs is the mode, which is about 5.8.
A plot of the probability distribution of the petal width variable is shown below.

Probability distribution of the petal width variable | Image by Author
From this plot, we observe that the probability distribution of the petal length variable has 2 maxima, hence it is bimodal. The values of the sepal length where the maxima occurs are the mode, that is at 1.7 and 5.0.
Mean
The mean value is a measure of central tendency. The mean value for the sepal length variable is obtained as follows:
data = datasets.load_iris().data
sepal_length = data[:,0]
mean = np.mean(sepal_length)
>>> 5.843333333333334
Median
The median value is also a measure of central tendency. The median value is less susceptible to the presence of outliers, hence a more reliable measure of central tendency, compared to the mean value. The median value for the sepal length variable is obtained as follows:
data = datasets.load_iris().data
sepal_length = data[:,0]
np.median(sepal_length)
>>> 5.8
Standard Deviation
Standard deviation is a measure of fluctuations of data values around the mean value. It is used to quantify the degree of uncertainty in the dataset. The standard deviation for the sepal length feature is calculated using the code below.
data = datasets.load_iris().data
sepal_length = data[:,0]
std = np.std(sepal_length)
>>> 0.8253012917851409
Confidence Interval
The confidence interval is the range of values around the mean. The 65% confidence interval is the range of values that are one standard deviation from the mean value. The 95% confidence interval is the range of values that are two standard deviations from the mean value. The boxplot below shows the mean value and 65% confidence interval for the sepal length feature.
sns.boxplot(data = iris, y='sepal_length')
plt.show()
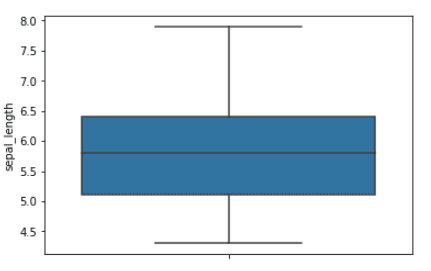
Boxplot for the sepal length feature. The blue region indicates the 65% confidence interval | Image by Author
Normal Distribution
Probability distributions can be used for predictive modeling. The sepal length feature only has 150 data points. Suppose that we would like to generate more data points. Then assuming that the sepal length feature is normally distributed, we can generate more data points. In the example below, we generate N = 1000 data points for the sepal length feature.
np.random.seed(10**7)
mu = mean
sigma = std
x = np.random.normal(mean, std, N)

num_bins = 50

n, bins, patches = plt.hist(x, num_bins,
                            density = 1,
                            color ='green',
                            alpha = 0.7)

y = ((1 / (np.sqrt(2 * np.pi) * sigma)) *
     np.exp(-0.5 * (1 / sigma * (bins - mu))**2))

plt.plot(bins, y, '--', color ='black')

plt.xlabel('sepal length')
plt.ylabel('probability distribution')

plt.title('matplotlib.pyplot.hist() function Example\n\n',
          fontweight ="bold")

plt.show()
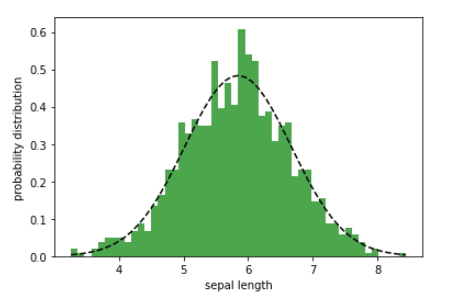
Probability distribution of the sepal length width | Image by Author
Bayes’ Theorem and Conditional Probability
Bayes’ theorem is an important theorem in statistics and data science. It is used for evaluating the predictive power of binary classification algorithms. A simple tutorial on how Bayes’ theorem is used in a binary classification algorithm is found here: Bayes’ Theorem in Plain English.
Conclusion
In summary, we’ve reviewed the essential statistical concepts useful for data science such as mode, median, mean, standard deviation, probability distributions, normal distribution, and Bayes’ theorem. Anyone interested in data science must learn the fundamentals of statistics.
Benjamin O. Tayo is a Physicist, Data Science Educator, and Writer, as well as the Owner of DataScienceHub. Previously, Benjamin was teaching Engineering and Physics at U. of Central Oklahoma, Grand Canyon U., and Pittsburgh State U.