
The previous KDnuggets Poll asked:
Which data mining/analytic tools you used in the past 12 months for a real project.
 The poll had a record participation (over 1,100 voters).
Among them, 43% used only commercial software, 32% only free software, and 25% both.
The average number of tools per user was 2.2.
The poll had a record participation (over 1,100 voters).
Among them, 43% used only commercial software, 32% only free software, and 25% both.
The average number of tools per user was 2.2.
RapidMiner, R, and Excel were again the most popular tools, with SAS remaining the top commercial tool.
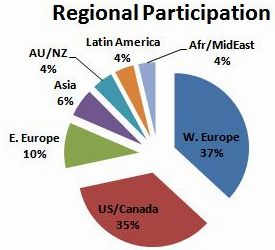
Pie chart shows the breakdown of voters by region.
We also note that W. European data miners had the highest % of free tool use (due to popularuty of tools like RapidMiner and KNIME there) - see
breakdown by region and tool type (commercial/free/both) below.
|
Which data mining/analytic tools you used in the past 12 months for a real project (not just evaluation)
[1103 voters] | |
|
| |
| RapidMiner (305) | |
| R (257) | |
| Excel (240) | |
| SAS (150) | |
| Your own code (134) | |
| KNIME (134) | |
| Weka (Pentaho) (130) | |
| Salford (117) | |
| Statistica (94) | |
| IBM SPSS Modeler (91) | |
| MATLAB (79) | |
| IBM SPSS Statistics (79) | |
| SAS Enterprise Miner (78) | |
| JMP (63) | |
| 11 Ants Analytics (62) | |
| Microsoft SQL Server (54) | |
| Other free software (45) | |
| Zementis (41) | |
| Other commercial software (35) | |
| Tableau (29) | |
| C4.5/C5.0/See5 (21) | |
| TIBCO Spotfire / S+ / Miner (19) | |
| Hadoop Map/Reduce (19) | |
| Mathematica (18) | |
| Revolution Computing (15) | |
| KXEN (15) | |
| Orange (14) | |
| Miner3D (14) | |
| XLSTAT (10) | |
| NoSQL databases (10) | |
| Stata (9) | |
| Other cloud-based tools (9) | |
| Bayesia (9) | |
| Angoss (9) | |
| Oracle Data Miner (8) | |
| Predixion (6) | |
| WordStat (5) | |
| Megaputer Polyanalyst/TextAnalyst (4) | |
| Portrait Software (3) | |
| Grapheur (3) | |
| Clarabridge (3) | |
| Centrifuge (3) | |
| Viscovery (1) | |
| Data Applied (1) | |
The following table shows breakdown by region and tool type: commercial/free/both.
| Region | |
| W. Europe | 22% 53% 25% |
| US/Canada | 62% 13% 26% |
| E. Europe | 52% 26% 22% |
| Asia | 43% 36% 21% |
| Australia/New Zealand | 62% 22% 16% |
| Latin America | 24% 37% 39% |
| Africa/MidEast | 39% 34% 27% |