
What is your annual salary/income range (in USD) and employment ?
This year the poll received about 500 votes - twice as many as in 2011, so the direct income comparison with 2011 may not be valid. For example, the lower avg. salary in Asia in 2012 may be due to much higher partication from Asia, so 2012 result is probably more representative.
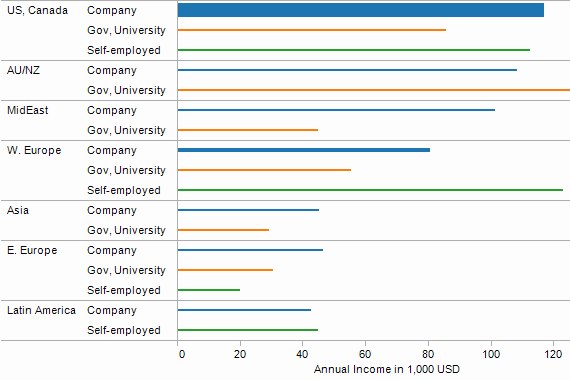
However, we see that US, AU/NZ and West Europe still lead in salaries, and we also see high compensation in Middle East (which did not get enough votes in 2011 to be included).
Also, we see growth in the number of self-employed analytics professionals, with high compensations for them. Here are more detailed results.
| Region | 2012 Salary (in thousands of USD) | 2011 Salary | 2012 Count |
|---|---|---|---|
| US/Canada | 111.5 | 112.9 | 307 |
| Australia/NZ | 99.6 | 91.0 | 13 |
| Middle East | 78.3 | n/a | 6 |
| W. Europe | 74.3 | 78.1 | 91 |
| Asia | 42.3 | 65.4 | 33 |
| E. Europe | 40.0 | 29.4 | 25 |
| Latin America | 43.5 | 52 | 10 |
The following figure gives a salary breakdown by employer. Bar height represents the number of people in that region/employment type.
For comparison, here are the results for
2011 KDnuggets Poll: Analytics/Data Mining Income/Salary by Region.
Comments
Andrew, February 10, 2012, more detailed geography
I find salary surveys to be too generic when grouping the whole of the US together as one, the same can likely be said of other global regions too.
For example, I review the robert half technology salary guide every year, this guide does a good job of defining a good set of technology jobs varying for senior management, to QA, to DBA, business analyst, etl developer etc., and provides an average salary range for the US as a whole. The guide then takes things 2 steps further by listing out some key skills that would boost that range by x% as well as big city multipliers to adjust the average range for a specific local market.
Looking at the regional multipliers for San Jose as 135% (the highest is New York) and Cleveland at 85% (not the lowest)... On AVERAGE, the same role in SJ would earn 50% more than they would in CLE. On average. Which means that a good percentage of people in SJ doing any particular role, earn quite a bit more than 50% more than they would in CLE.
Thats a big difference, which you just dont see with a national average.