
The New York Times has a very interesting visualization of Netflix rental patterns by neighborhood, in a dozen metropolitan areas: New York, Boston, Chicago, Washington D.C., Bay Area, LA, Seattle, Minneapolis, Denver, Atlanta, Dallas, Miami. You can see the distribution of top movies by zip codes.
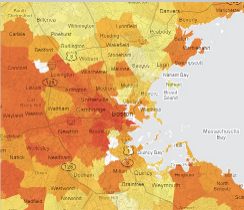 In this visualization, the zip codes around Boston are "redder" if the rank of the movie "Rachel getting married" is higher.
Very interesting picture of a suburban belt viewers.
In this visualization, the zip codes around Boston are "redder" if the rank of the movie "Rachel getting married" is higher.
Very interesting picture of a suburban belt viewers.
Could it help for the next Netflix prize competition?
Read full story.