
Date:
by Robert A. Muenchen, June 20, 2010
This page presents various ways of measuring the popularity or market share of BMDP, JMP, Minitab, R, R-PLUS, Revolution R, S-PLUS, SAS, SPSS, Stata, Statistica, and Systat.
When choosing analytical tools to use, it can be helpful to know the size of the software's market share and whether it is growing or shrinking. However, that's easier said than done. Sales figures reported by some commercial vendors include products that have little to do with analysis. Open source software such as R (Ihaka and Gentleman 1996) could count downloads but one person can download many copies, inflating the total and many people can install from a single download, deflating it. Download counts for the R-based Bioconductor project are located at www.bioconductor.org/packages/stats/. Similar figures for Stata downloads are available at http://logec.repec.org/scripts/itemstat.pf?type=redif-software.
Internet Discussion
There are some stable and objective measures regarding analytic software. Schwartz (2009) suggested plotting the amount of email discussion devoted to each. The most widely used packages all have discussion lists devoted to them. Those with less use either do not, or like the list for Minitab, may have only a dozen or so emails per year. Some software packages have multiple discussion lists. For example there are twenty devoted to using R for various focused areas such as mapping, ecology, epidemiology, etc. (www.r-project.org/mail.html). A broader list, including a version of R-Help in Spanish lists 48 discussions (https://stat.ethz.ch/mailman/listinfo).
Some vendors also offer support forums. For example SAS Institute has 17 on topics such as general procedures, statistical procedures and graphics. However when this was written the traffic on SAS-L seemed much higher.
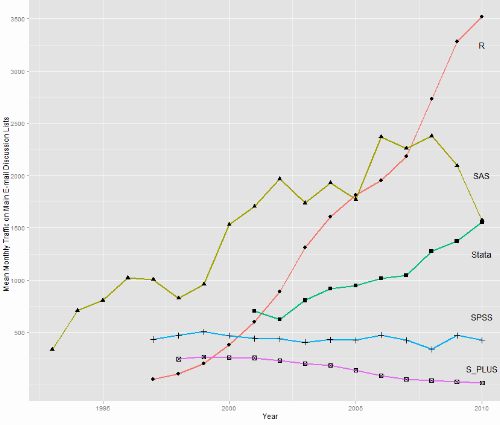
Figure 1. Plot of e-mail discussion traffic by month. The year 2010 includes January through May.
We can see that so far in 2010, R is the most discussed software by roughly a two-to-one margin, followed by SAS and Stata in a tie. SPSS has had a very consistent amount of discussion over the years. SPSS traditional user base is in the social sciences where, in my experience, people are less interested in programming and more interested in the product's easy-to-use graphical user interface. If it's true that use of graphical interfaces reduce questions, then the decline in SAS-L participation could be the result of increased use of its Enterprise Guide product. R and S-PLUS are both implementations of the S language and so are in the most direct competition. From the view of Internet discussion, S-PLUS is experiencing a significant decline.
Read more at r4stats.com/popularity