
The previous KDnuggets Poll asked:
What part of your analytics / data mining work in the past 12 months was done in R?
This was one of the more popular recent polls, with 360 voters.
The poll results suggest a bi-polar distribution, with 36% not using R, and 34% using R for more than half of their analytics work. Most people use R in conjunction with other tools, and below is a great wealth of links about them.
| What part of your analytics / data mining work in the past 12 months was done in R? | |
| None |
|
| 1-25% |
|
| 26-50% |
|
| 51-100% |
|
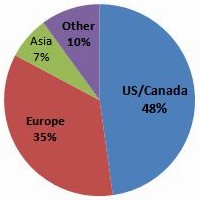 Regional analysis shows that European data miners are more likely to be using R for a majority of their work.
- US/Canada: 48%
- Europe: 35%
- Other: 17%
Tim Goh lists many R user interfaces, including
core R interface, scripts & command line,
Rattle, R Commander, Red-R (based on Orange and R), RevolutionAnalytics, RKWard, RStudio, RapidMiner (with R extension), Eclipse with Stat-ET, IBM SPSS Modeler (with R interface), JGR (Java GUI for R, pronounced "jaguar"), KNIME (with R extension), PMG (Poor man's GUI), Quick-R, SAS (with R interface), SciViews-R, and more...
Here are the full results of KDnuggets Poll:
What part of your analytics / data mining work in the past 12 months was done in R?
including comments on R interfaces, and R integration with RapidMiner and other tools.