
The
 Election Visualizer from Advisor Solutions
lets you
Election Visualizer from Advisor Solutions
lets you
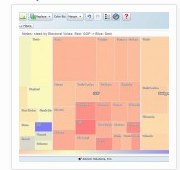
- Visualize 2012 Polling Data: See the data the way YOU want through Interactive Visualization. Drill down on one or many dimensions and build your own Analysis Tools
- Drill Down to Discover Trends: Be your own analyst! Slice and dice different pieces of data to create meaningful Interactive Visualizations
- Filter Data by Polls
- Make your own Decisions