Orchestrating Dynamic Reports in Python and R with Rmd Files
Do you want to extract csv files with Python and visualize them in R? How does preparing everything in R and make conclusions with Python sound? Both are possible if you know the right libraries and techniques. Here, we’ll walk through a use-case using both languages in one analysis
By Marija Ilic, Data Analyst/Scientist

Python Inside R and Vice Versa
Several supporting packages written in Python and R allow analysts to combine Python and R in one Python or R script. Those familiar with R can use the reticulate package to call Python code inside R. Then, an R script is interoperable between Python and R (Python objects are translated into R objects and vice versa). However, if you use Python but want to use some functionalities of R, consider using the rpy2 package written in Python to enable embedded R code.
R markdown, a popular framework for combining code and results in one output, provides an elegant Python and R integration. We’ll create a dynamic report combining both languages in one Rmd script. We’ll use forex trading data to capture price movements in 15 minute intervals and then plot a candlestick graph that trading analysts use in pricing models (OHLC charts).
Running R with Python Code in R Markdown Documents
An R markdown, or Rmd, is a text file containing text or commentary (combined with text formatting) and chunks of R code surrounded by ```. From a file, inside R or R Studio, you can create and render useful reports in output formats like HTML, pdf, or word. However, the primary benefit is that source code, outputs, and comments are contained in one file, facilitating easy collaboration among your team.
Even R lovers may not know that Rmd files can contain Python chunks. More conveniently, objects are shared between the environments, allowing programmers to call objects in Python and R in the opposing language.
R Markdown with Python
Let’s examine how to use Python in Rmd. First, ensure Python is installed on your computer and all Python libraries or modules you’re planning to use in Rmd are installed (pip works and virtual environments can be utilized, if preferable).
In Rmd files, Python code chunks are similar to R chunks: Python code is placed inside marks: ```{python} and ```.
Here’s a simple R markdown with embedded Python code:

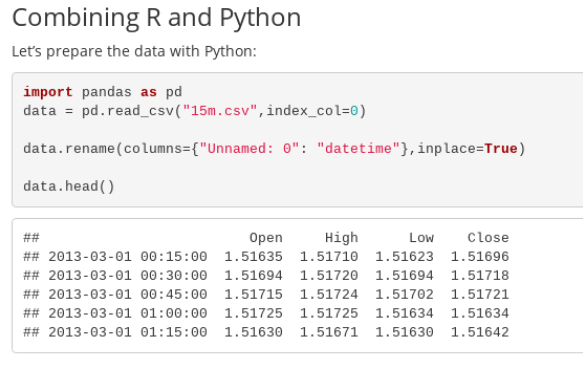
In the example above the csv is loaded with the help of the pandas library, a column is renamed, and the first rows are printed. In the file heading, the report is defined with ### and a single author comment is printed. Here’s the result when we run the Rmd:
Beside the code and output, the heading and author comment prints. Now that the data has been loaded using Python, it can be used inside R:
The R code starts with ```{r} and ends with ```. The code is followed by a Python chunk and an object referenced inside the R code. In our example, the R object is converted from Python object with the help of reticulate package. The command py$data retrieves the object that is created in Python and converts it into R data frame. Now, when R data frame is created, it can be used further in R code.
Here is how the output looks like:

Now we’ll continue with using R and create a visual that traders utilize frequently: the candlestick graph. Here’s the R code for the Candlestick graph, written in the plotly library:
That should display the following:
This simple example demonstrates how Python and R can be used for report creation. The popular Python pandas library is used for loading and data prep. Then, R is used for visualization.
An R data object can be created and then subsequently referenced in a Python environment. Below is an example of this, where a visual with the Python mpl_finance module is created:
That’s it! You can now choose which language to use, or have your team collaborate in their language of preference.
Getting Started with Rmd
R and Python courses are available on popular platforms (e.g.: Coursera, Udemy, Vertabelo Academy, Data Camp). Data visualization concepts are also covered in many. Both R and Python are great for data science, and it’s possible to work in both. If you’re encouraged to start learning, consider taking these:
- On Coursera, there is a great course about reproducible research and the basics of R markdown:
https://www.coursera.org/lecture/reproducible-research/r-markdown-5NzHN - If you’re not familiar with R, Data Camp has a good introduction here:
https://www.datacamp.com/courses/free-introduction-to-r - As an author at Vertabelo Academy, I can personally recommend our Python and R courses.They’re focused on those coming from a business background especially:
https://academy.vertabelo.com/course/python-data-science
https://academy.vertabelo.com/course/data-visualization-101 - Edx has many Python and R courses, including those from Harvard, IBM, Microsoft. For Python beginners, try this IBM course: https://www.edx.org/course/python-basics-for-data-science-2
Summary
Python and R are the hottest data science languages today. It’s good to be familiar with both, since projects may require aspects from each. There are many packages to help integrate both for use-cases. One is R markdown, a file format for making dynamic documents in R. Rmd files integrate seamlessly executable code and commentary. With the help of the reticulate package, R objects can be reached easily in Python and vice versa. Analysts now need not choose between Python and R — it is possible to integrate both in one file.
Bio: Marija Ilic works as a data analyst/scientist. She likes to analyze huge amounts of data. Marija has an extensive background in DWH/ETL development in the banking industry.
Related:
- Set Operations Applied to Pandas DataFrames
- Ten more random useful things in R you may not know about
- Customer Segmentation for R Users