Create Efficient Combined Data Sources with Tableau
Save time and effort with this guide, which will show you how to do data join operations in Tableau.
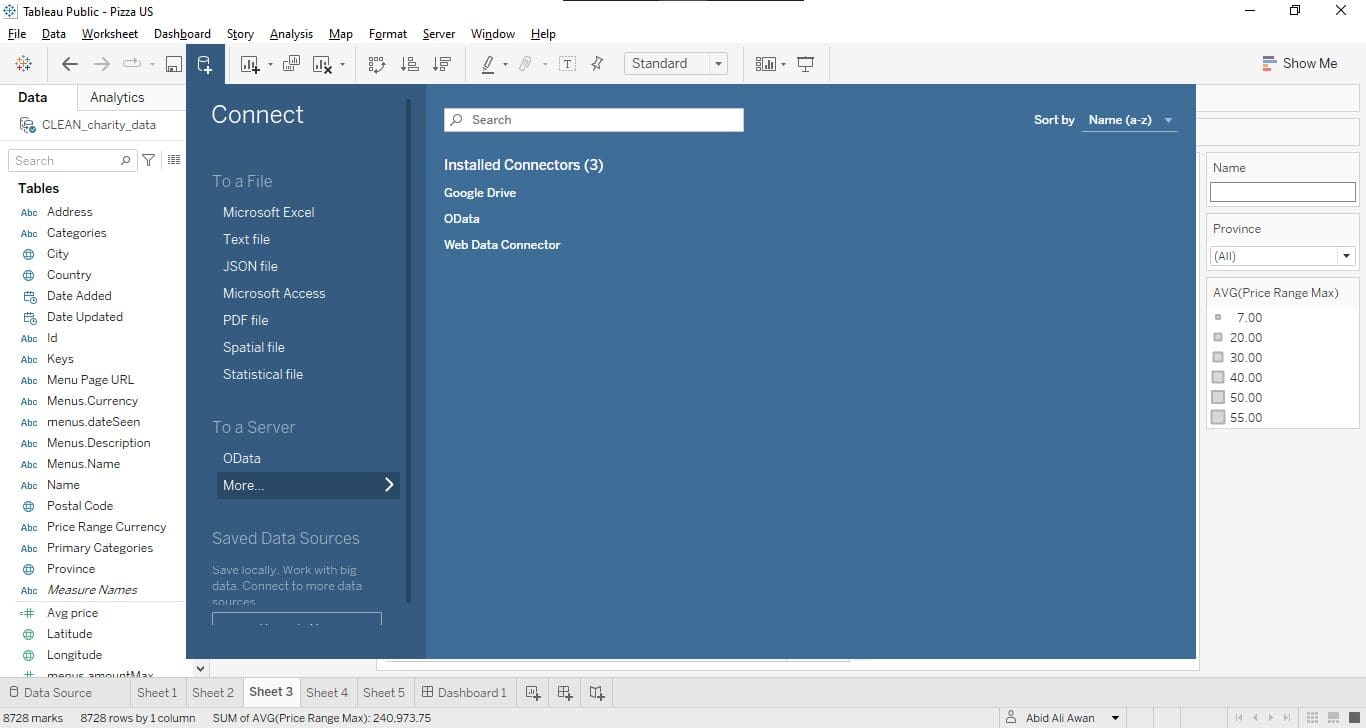
Image by Editor
You spend a lot of time and resources on Tableau. Now the time has come to combine datasets. Need to merge Excel files or an SPSS file? How about consolidating multiple data sources into one tableau data source or combining external data with internal data? Save time and effort with this guide, which will show you how to do data join operations in Tableau.
So, What is Tableau?
You've probably heard the word "Tableau" being used in one context or another, but you may not know what it means.
Tableau is a software suite used to analyze data and meet business objectives by looking at the big picture. It helps create insights from your data so you can make informed decisions about your business and where you want it to go.
One of the best ways to get insights from data is to build tables in Tableau. Data tables are useful for combining data sources, drilling into data, and getting visual answers, right away!
Methods of Combining Data: Overview
There are two ways to combine data in Tableau: data joining and data blending. Data joining is when you perform tasks with multiple tables or views from the same source (e.g., tables from the same database, Excel sheets inside the same workbook, text files within the same directory). In most cases, Tableau performs well when you join them.
Figure 1 shows the data joining method in the tableau using the inner data joining technique. While Figure 2 represents the data blending methods in Tableau.

Figure 1 Data joins in Tableau (Source (tutorialspoint, n.d.))
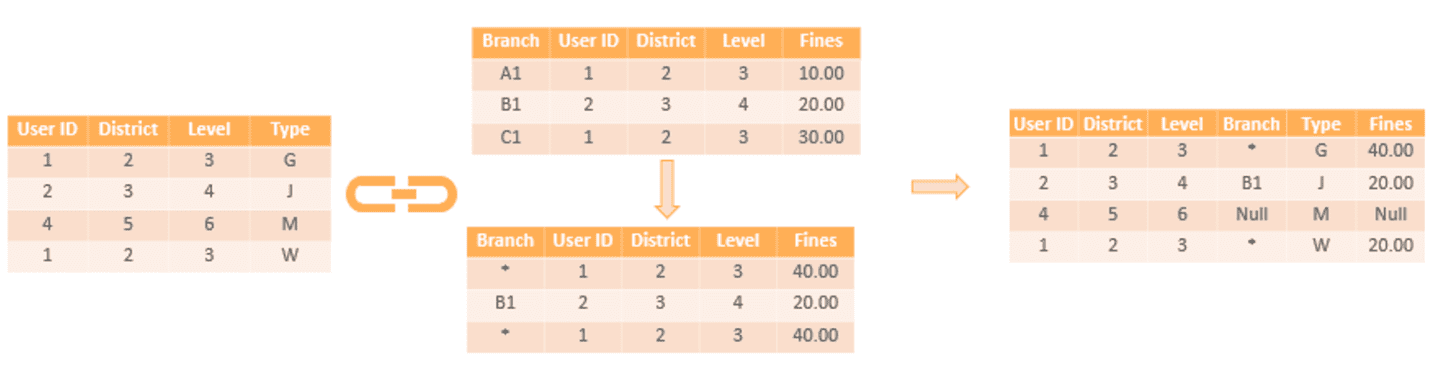
Figure 2 Data blending in Tableau (Source (Upasana, 2021, 12)))
To use a data join, you need to know two things: how to create a join in SQL and how to tell Tableau what it is. With a data join, once you’ve connected the table or view from which you’re joining, all you need to do is add an extra step where you drag the field that joins both tables together on the “Join” shelf.
Data Sources in Tableau
A data source in Tableau connects your source data to Tableau. It's simply the sum of your data (either as a live connection or an extraction), the connection metadata, the names of tables or worksheets containing data, and the modifications you apply to data in Tableau. This comprises metadata such as computations, renamed features, and default layout, as well as how the data is integrated.
Figure 3 Data Sources in tableau (Source (Dmitry Anoshin, Teodora Matic, Slaven Bogdanovic, Tania Lincoln, 2019))
Combining the Data Sources Effectively
Tableau allows you to create efficient combined data sources so that you only need to do the work once, and then you can use that source for multiple reports.
Here are some tips for creating these sources:
- Make sure your data is in the same field order
- Make sure your data is in the same format
- If possible, make sure your data contains a unique identifier (such as a customer ID)
- Assign a different color to each field in the same table
- Name your sheets descriptively
- Name your columns descriptively
If you do all this; you'll have a very easy time creating combined data sources in Tableau!
Combine the Tables Wisely
Limit the number of tables in a workbook to the fewest amount possible, to create a better user experience. If you need access to multiple tables from a workbook, you may want to create separate data sources that can be used for each analytical scenario.
Effective Combining Using Joins
Joins are important because they allow us to combine information from multiple sources into a single visualization. A lot of the time they're used to join data from different worksheets in a workbook, but there's no limit to what you can do with joins! You can use them to combine data from different databases, files on your computer, or even from completely different sources!
While working with multiple tables in Tableau the best approach is to define the joins in the data connection window. In this way, you are not defining a specific query – you are simply defining how the tables corelate to one another.
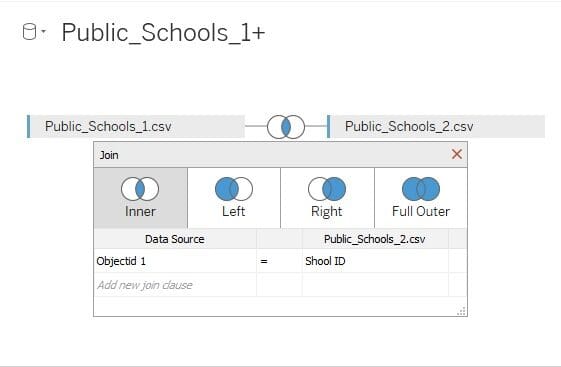
Figure 4 Joins in Tableau (Source (Dmitry Anoshin, Teodora Matic, Slaven Bogdanovic, Tania Lincoln, 2019))
This data will be used by Tableau to generate the specific query required to fetch only the specified required data.
As a basic performance rule-of-thumb, the number of joined tables should be minimized to only include the tables needed for a specific worksheet /visualization. (Eldridge, 2016)
Effective Combining Using Blends
If your data contains many unique values, it will take up a lot of memory. You should use the 64-bit version of Tableau Desktop if you’re using blends with large numbers of unique values. Blends that rely on many unique values are most likely to take a longer time for computations.
Using Data Integration
A new feature, data integration, is available in Tableau 10 that allows you to combine data from multiple sources. Data integration works with row-level joins, whereas blending works on the results of each data source. You must use data integration if you want to work with more data or flow at a faster rate.
Adjust the Level of Details
When developing a curated data source, consider whether the aggregation should typically be performed at a specific Level of Detail (LOD). If so, consider creating a new calculated field containing a LOD Expression at the appropriate LOD as a convenience to future developers.
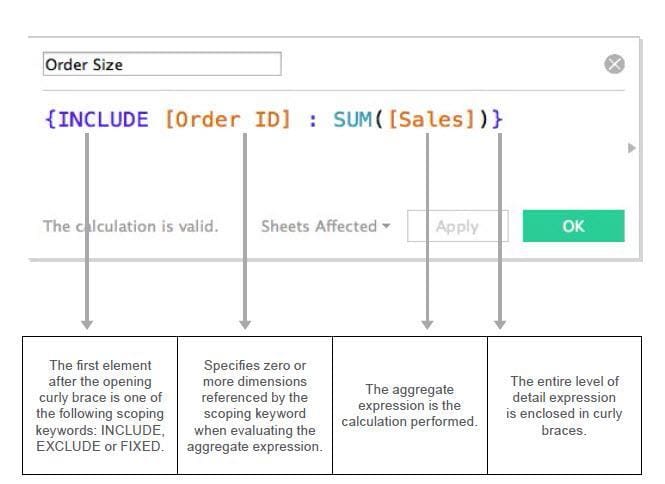
Figure 5 An Example of Level of Details in Tableau (Source (Dobiasz, 2019))
Conclusion
Data is not easy to work with. It may be something that every business seeks, but it can be quite an ordeal to gather it, analyze it, and determine its usefulness. Furthermore, this process must be repeated each time a business wants or needs to use data. Instead of having to jump through multiple hoops and overcome several difficult hurdles, all you have to do is tell Tableau how you want your data prepared.
You can integrate as many data sources that you want in tableau and create all in one dashboard. This will help you get the insights that you need to make a quick decision on your business.
References
- Dmitry Anoshin, Teodora Matic, Slaven Bogdanovic, Tania Lincoln. (2019). Tableau 2019.x CookBook. SMTE Books.
- Dobiasz, L. (2019, 11 3). the data school. Retrieved from https://www.thedataschool.com.au/wp-content/uploads/2019/11/LOD-expressions-1.jpg
- Eldridge, A. (2016). Best Practices for Designing Efficient Tableau Workbooks.
tutorialspoint. (n.d.). Tutorials Point. Retrieved from tutorialspoint: https://www.tutorialspoint.com/tableau/images/data_join_1.JPG - Upasana. (2021, 12). edureka. Retrieved from edureka: https://www.edureka.co/blog/wp-content/uploads/2019/02/Data-Blending-with-Fines-Data-Blending-in-Tableau-Edureka.png
Neeraj Agarwal is a founder of Algoscale, a data consulting company covering data engineering, applied AI, data science, and product engineering. He has over 9 years of experience in the field and has helped a wide range of organizations from start-ups to Fortune 100 companies ingest and store enormous amounts of raw data in order to translate it into actionable insights for better decision-making and faster business value.