Top 5 Bookmarks Every Data Analyst Should Have
Check out these online tools to save you time & effort.

Photo by cottonbro
As a Senior Data Analyst, my job typically consists of one or two large underlaying data research projects with a scattering of “time sensitive” smaller projects for different teams. During a typical week, I might make 5–7 charts, write a few queries, tweak a few more, and help a coworker debug theirs. I’ll probably post 1 or 2 internal JIRA tickets and perform a few StackOverflow searches.
The major underlying problem is that with these side distractions, I’m only one random adhoc question away from being derailed from the bigger task at hand. That is why the best analysts are nimble and fast. They roll with the punches and quickly get the menial work out of the way.
The truth is that being a good analyst is all about balancing quality versus speed. This manifests itself in finding good tools which help make you more efficient. In that given week, I might use a half-dozen different tools and software. And if there is one thing that analysts all agree upon, it is that no single tool does everything great. That is why one of my biggest pieces of advice to young analysts is to start a collection of online bookmarks. Get in the habit of exporting those bookmarks so you can take them with you when you switch jobs or upgrade your computer.
Here are the Top 5 bookmarks that every analyst should have. Some are useful on a daily basis, and others are situational and rarely used. However, you’ll probably need them someday, and when you do — it’ll save you a lot of headaches and time.
5. Ascii Table Formatter
A table formatter lets you convert a block of copy/pasted data into a much more efficient and aesthetically pleasing format. This comes in handy in a variety of different ways. Sometimes I send colleagues a quick table through Slack or email; other times I paste data into a JIRA ticket. Additionally, a table formatter is very useful for posting or answering questions in forums, like Stack Overflow, or posting data in your blog. The trick is to choose a monospaced font like Courier New for it to line up properly.
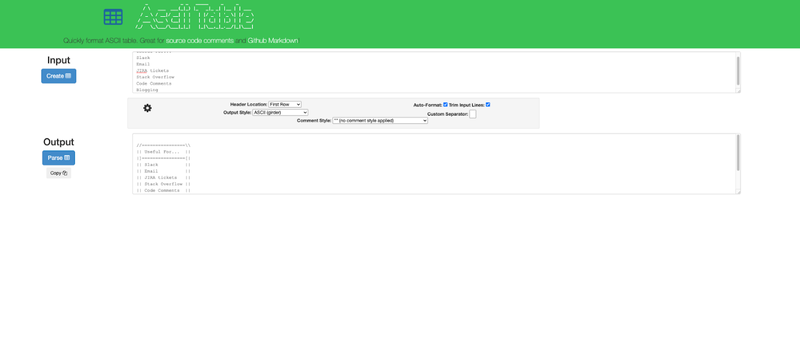
//================\\

|| Useful For...  ||

|]================[|

|| Slack          ||

|| Email          ||

|| JIRA tickets   ||

|| Stack Overflow ||

|| Code Comments  ||

|| Blogging       ||

\\================//
There are a ton of choices, but the one that I like the most is https://ozh.github.io/ascii-tables/. It is fast, simple, and has a lot of different choices for the output format. Additionally, Ascii Table Formatter will automatically convert the text without having to click anything; it is instant!
Here are a few different examples:
4. SQL Beautifier
There are two types of SQL writers — those who take pride in their queries and format it to be easier to read and those who like to watch the world burn. Whether you want to format someone else’s mess or your own — a SQL Beautifier is essential.
The next time you find yourself trying to decipher a query that looks like this:
Use a SQL Beautifier to instantly make it look like this:
There are plenty of options out there in the form of downloadable programs, plugins, and online versions. I prefer the online version, here: https://codebeautify.org/sqlformatter.
3. JSON Viewers and Converters
I try to avoid working with JSON data as much as possible, but unfortunately, sometimes, I have no choice. That’s why I keep a variety of JSON-related viewers and converters in my bookmarks.
Want to quickly browse a JSON structure to see what elements are available? Need to debug why your parsing script is failing? Then I recommend checking out https://www.convertcsv.com/json-to-csv.htm and https://www.convertcsv.com/csv-to-json.htm for converting between tabular and JSON structures, and http://jsonviewer.stack.hu/ for parsing and viewing it.
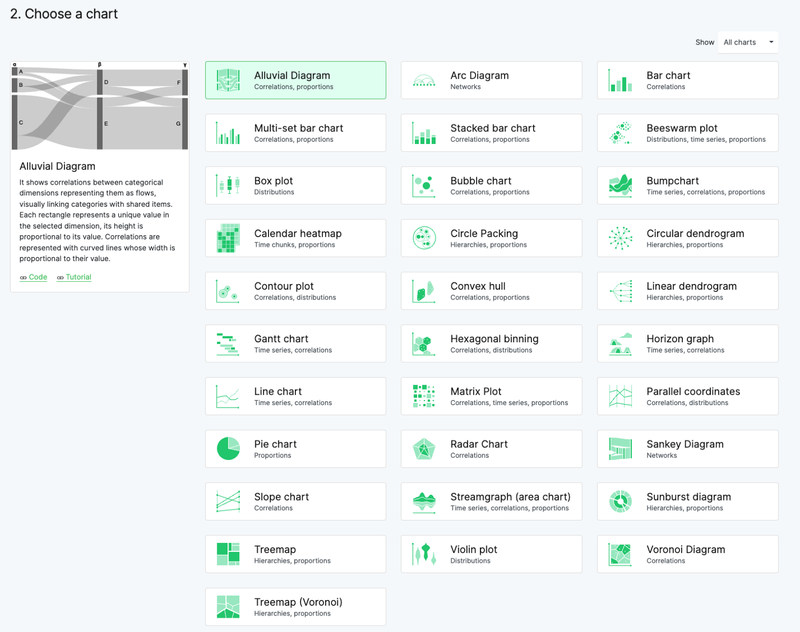
2. Graph Builders
Building visualizations and dashboards are an important part of an analyst’s job. Unfortunately, I estimate that about 80% of the charts I make are not actually for a dashboard but for answering quick, adhoc questions. Launching a specialized application like Tableau or fiddling with Excel is just overkill for many of those tasks. Instead, I need something that can build a chart quickly.
There are plenty of online resources for building quick graphs, but https://app.rawgraphs.io/ is my favorite. I like it because it has a wide range of lesser-known chart types (like Calendar heatmap and Circle Packing) that otherwise take too long to figure out in Excel.
1. SQL Generator
Most analysts have not actually memorized the syntax for every type of transformation under the sun. Rather, most will recall a previous query that did something similar, and they’ll dig through their folder of Untitled1.sql, Untitled2.sql, and Copy of RevenueQuery_final_final_final(3).sql until they find it. Alternatively, Google can come to the rescue, but this requires loads of time trying to find the correct question on forums or a tutorial with the correct syntax.
Instead, bookmark yourself a good SQL Generator. A SQL Generator is basically a template for a SQL query, which lets you customize column names and table structure, choose the operation that you want to do, and then it constructs the syntax for you in a variety of different “flavors” of SQL.
Never stress about the subtle differences between DATEDIFF() vs DATE_DIFF()again! I recommend this one: https://app.rasgoml.com/sql
Conclusion
The truth is that being an analyst is all about balancing quality versus speed. Having a toolkit available that helps you cut corners without sacrificing quality is a certain way to improve your effectiveness. If you don’t currently have a bookmarks folder of “Tools,” hopefully, this article gives you a good starting point!
What about others? Do you have any go-to bookmarks that I missed?
Community Suggestions
- RegEx Helper — Wesley Longsworth (Regexr, Regex101)
Josh Berry (@Twitter) leads Customer Facing Data Science at Rasgo and has been in the data and analytics profession since 2008. Josh spent 10 years at Comcast where he built the data science team and was a key owner of the internally developed Comcast feature store - one of the first feature stores to hit the market. Following Comcast, Josh was a critical leader in building out Customer Facing Data Science at DataRobot. In his spare time Josh performs complex analysis on interesting topics such as baseball, F1 racing, housing market predictions, and more.
Original. Reposted with permission.