
Simpson’s Paradox and its Implications in Data Science
The importance of Simpson’s Paradox and why you need to consider it when working with data.

Image by Author
Data Scientists, Data Engineers, and Machine Learning Engineers spend a lot of their time looking at data and finding statistical drawings or conclusions from it. But a big thing that is a required skill for these professionals and anyone looking at data is having a good intuition for the real world.
Data has several variables that you can take into consideration, however, it is good to note that it produces a finite-dimensional representation. This is where you will have to see beyond the data and figure out what the hidden reality is and how it can be applied to the dataset.
Simpson’s paradox proves to us the importance of being skeptical when interpreting your data, and ensuring you apply the real world - without restricting yourself from seeing it from a data viewpoint.
What is Simpson’s Paradox?
In 1972 Colin R. Blyth introduced the name Simpson’s paradox, also known as Simpson’s reversal, the Yule-Simpson effect, amalgamation paradox or reversal paradox.
Simpson’s Paradox is when a trend or output is present when the data is put into groups that either reverse or disappear when the data is combined. It is a statistical paradox where it can draw two opposite conclusions from the same data, depending on how the data is grouped.
UC Berkeley and Simpson’s paradox
A popular example of Simpson’s paradox is UC Berkeley’s study on gender bias in graduate school admissions. In 1973, at the start of the academic year, UC Berkeley's graduate school admitted around 44% male applications and 35% female applicants. The school feared that they were up against a lawsuit, therefore prepared for this by asking Peter Bickel, a statistician to have a look at the data.
What he found out was there was a statistically significant gender bias that was in favor of women in 4/6 departments, and that there was no significant gender bias in the remaining 2. The team's findings showed the women applied for departments that had an overall smaller percentage of applicants.
In Simpson’s Paradox, you need to take into consideration real-world scenarios and variables that can be hidden and not easily interpreted through data. In this example, the hidden variable is that more women were applying for a specific department. This affects the overall percentage of accepted applicants, in a way that shows the reverse trend that initially existed in the data.
The team then concluded that their output on the data changed when they took it into account when dividing the school into departments.
The image below explains how the trends reverse when the data are grouped:
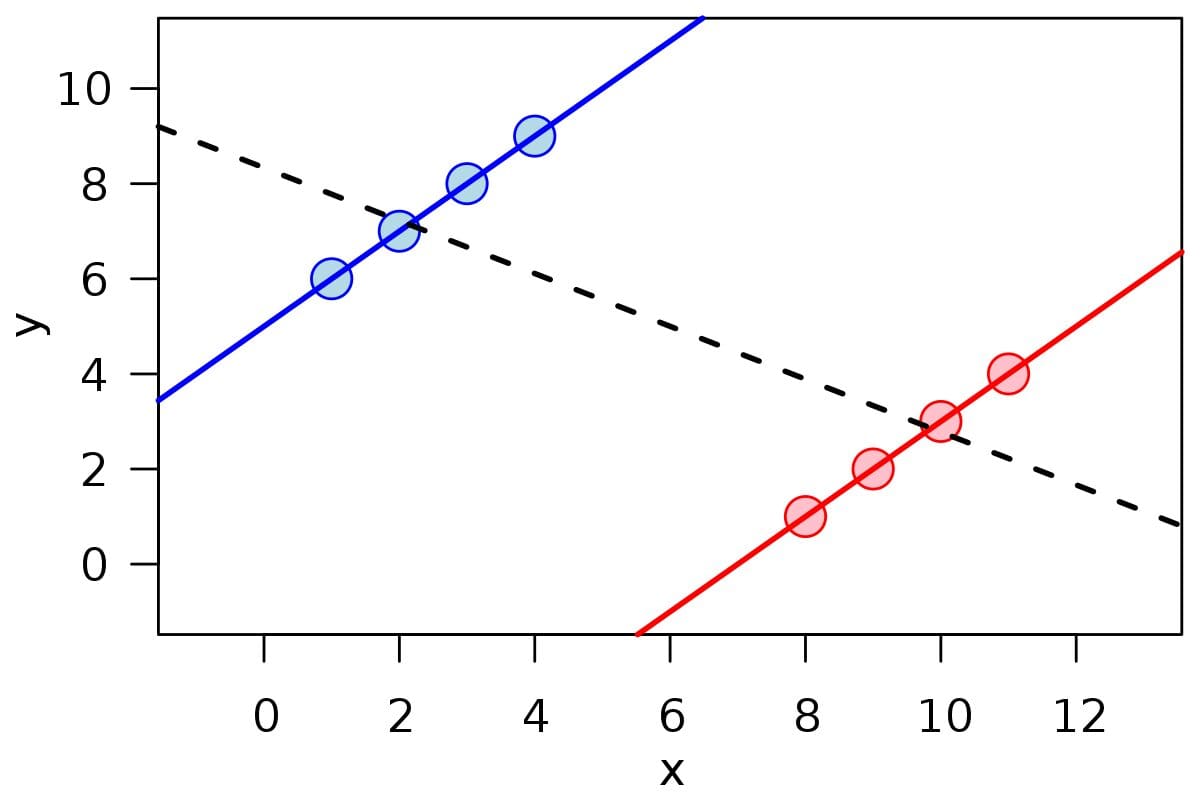
Image by Wikipedia
Simpson’s paradox can make working with data more complex and make the decision-making process much harder.
If you start to resample your data differently, you will come out with different conclusions. This will naturally make it harder for you to choose one specific accurate conclusion to draw further insights. This means that the team will have to find the best conclusion that has a fair representation of the data.
Why is Simpson’s Paradox important in Data Science?
When working with data-related projects, we are often focused on the data and try to interpret the story it’s trying to tell us. But if we apply real-world knowledge, it would tell us a completely different story.
Understanding the importance of this opens up more opportunities for us to look deeper into the data and perform sufficient analysis to help in the decision-making process. Simpson’s Paradox focuses on how a lack of sufficient analytical insight and overall project knowledge can mislead us and make wrong decisions.
For example, we are seeing a rise in the use of real-time data analytics. More and more teams are implementing this to help detect patterns, and use this insight to make decisions in short periods. Working with real-time data analysis is effective when you are focusing on how to improve a company based on the current real-time data. However, these short periods can cause misleading information and hide the overall true trend that the data shows.
The wrong data analysis can hold a company back. And we all know that wrong decisions always hold a company back. Therefore, taking into consideration Simpson’s paradox benefits the company to understand the limitations of the data, what drives the data, and the different variables and keeps bias low.
Simpson’s Paradox helps remind professionals working with data about the importance of understanding data and their level of data intuition. This is when a lot of data professionals' soft skills will present themselves, such as critical thinking.
The aim is to look for hidden biases and variables that are present in the data, which may not be easily discoverable at first look or when high analysis has been performed.
Conclusion
One thing to take into consideration about Simpson’s paradox is that too much aggregation of data can soon become useless and start to introduce bias. But on the other hand, if we don’t aggregate the data, the data can be limited in the information and underlying patterns it can tell us.
To avoid Simpson’s paradox, you will need to review your data thoroughly and ensure you have a good understanding of the business problem at hand.
Nisha Arya is a Data Scientist, Freelance Technical Writer and Community Manager at KDnuggets. She is particularly interested in providing Data Science career advice or tutorials and theory based knowledge around Data Science. She also wishes to explore the different ways Artificial Intelligence is/can benefit the longevity of human life. A keen learner, seeking to broaden her tech knowledge and writing skills, whilst helping guide others.