What I Learned From Using ChatGPT for Data Science
ChatGPT can be a great tool for data scientists. Here’s what I learned about where it excels and where it is less so.
Image by Author
There’s one single lesson I learned from using ChatGPT. It’s wonderfully helpful in data science, but you must scrutinize everything it outputs. It’s great for some tasks and can do them very quickly and accurately. For some other tasks, it’s good enough, and you’ll have to prompt it several times. And there’s one task I found ChatGPT is outright bad at.
Great: Automate Data Exploration
You can attach your dataset to the ChatGPT message, and by giving several simple instructions, ChatGPT can explore data for you.
For instance, I can take a dataset from this data project. The instructions I gave are:
“Use the attached data to perform a descriptive statistical analysis. Include the following:
- Summarize basic statistics (mean, median, standard deviation, etc.).
- Identify missing values and suggest strategies to handle them.”
It returns the summary that looks like this. It does the same calculation for each variable.
Age:
- Mean: 28.79 years
- Standard Deviation: 6.94 years
- Range: 18 to 50 years
It also identified no missing values in the dataset.
If you also need the Python code for these calculations, you can prompt it to write them.
To load the dataset, use this code.
aerofit_data = pd.read_csv(file_path)
For basic statistics, it gives this one.
basic_stats = aerofit_data.describe()
And you can check the missing values with this code.
missing_values = aerofit_data.isnull().sum()
Great: Create Visualizations
Further, I can ask ChatGPT to visualize the distribution of key variables and detect potential outliers and anomalies.
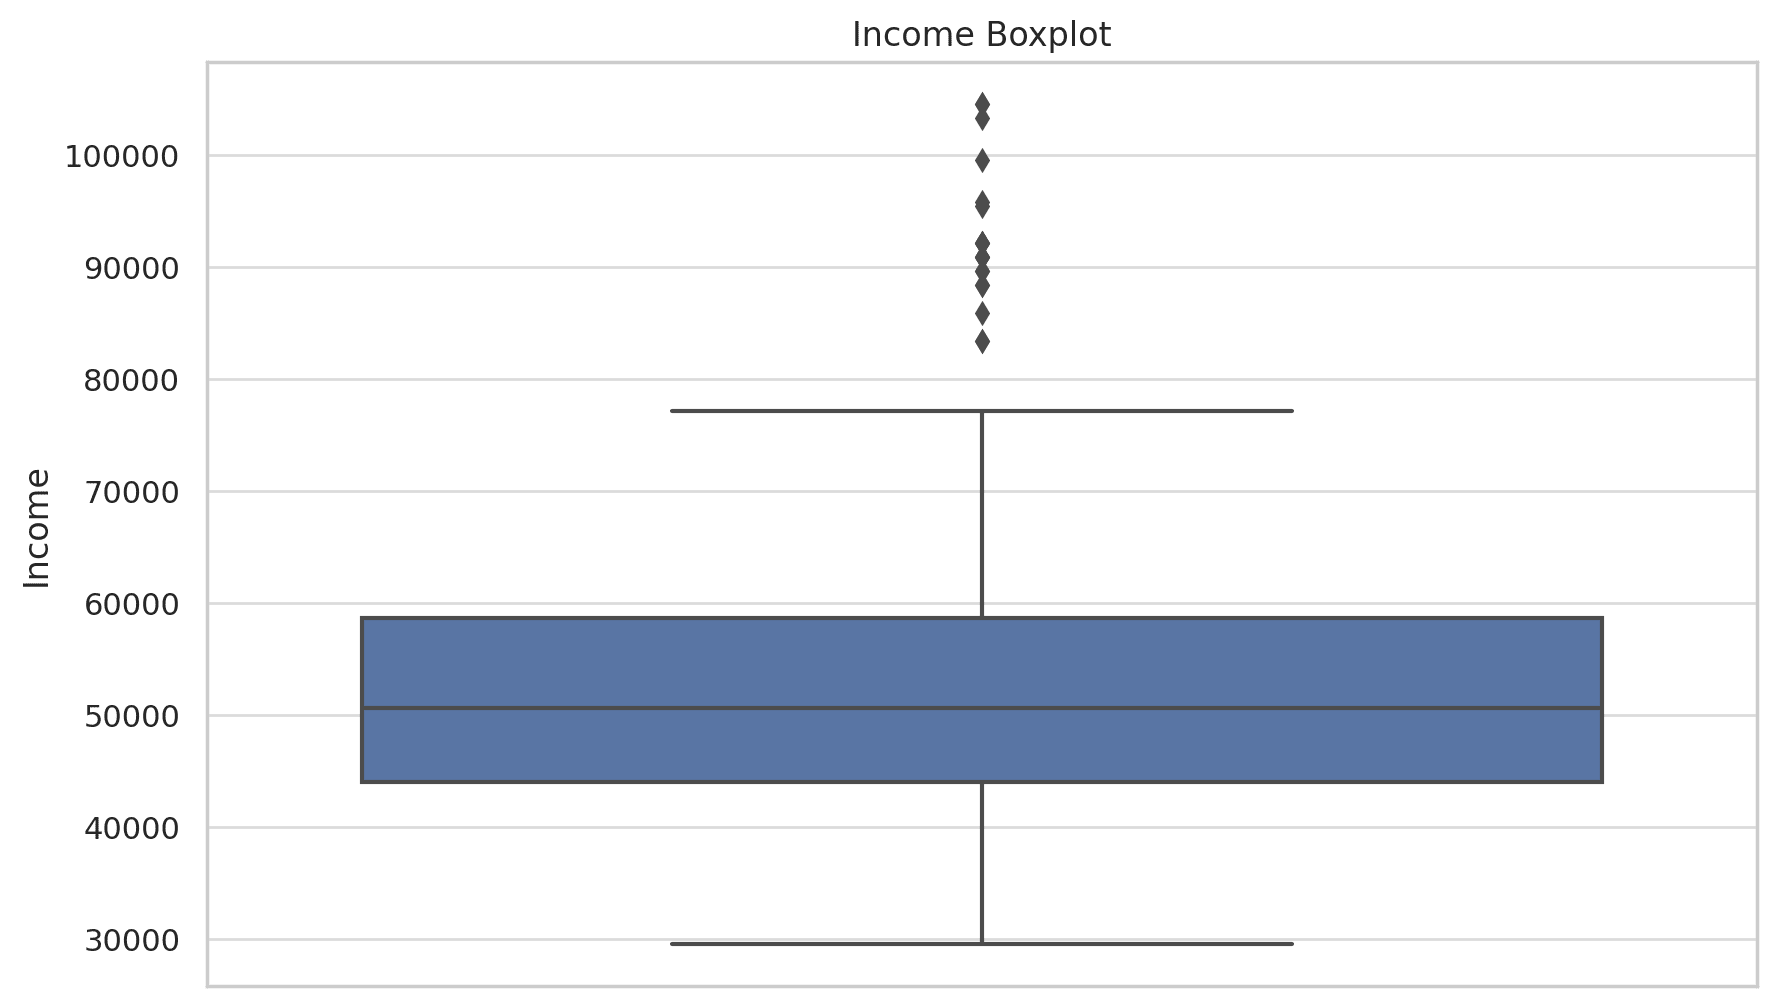
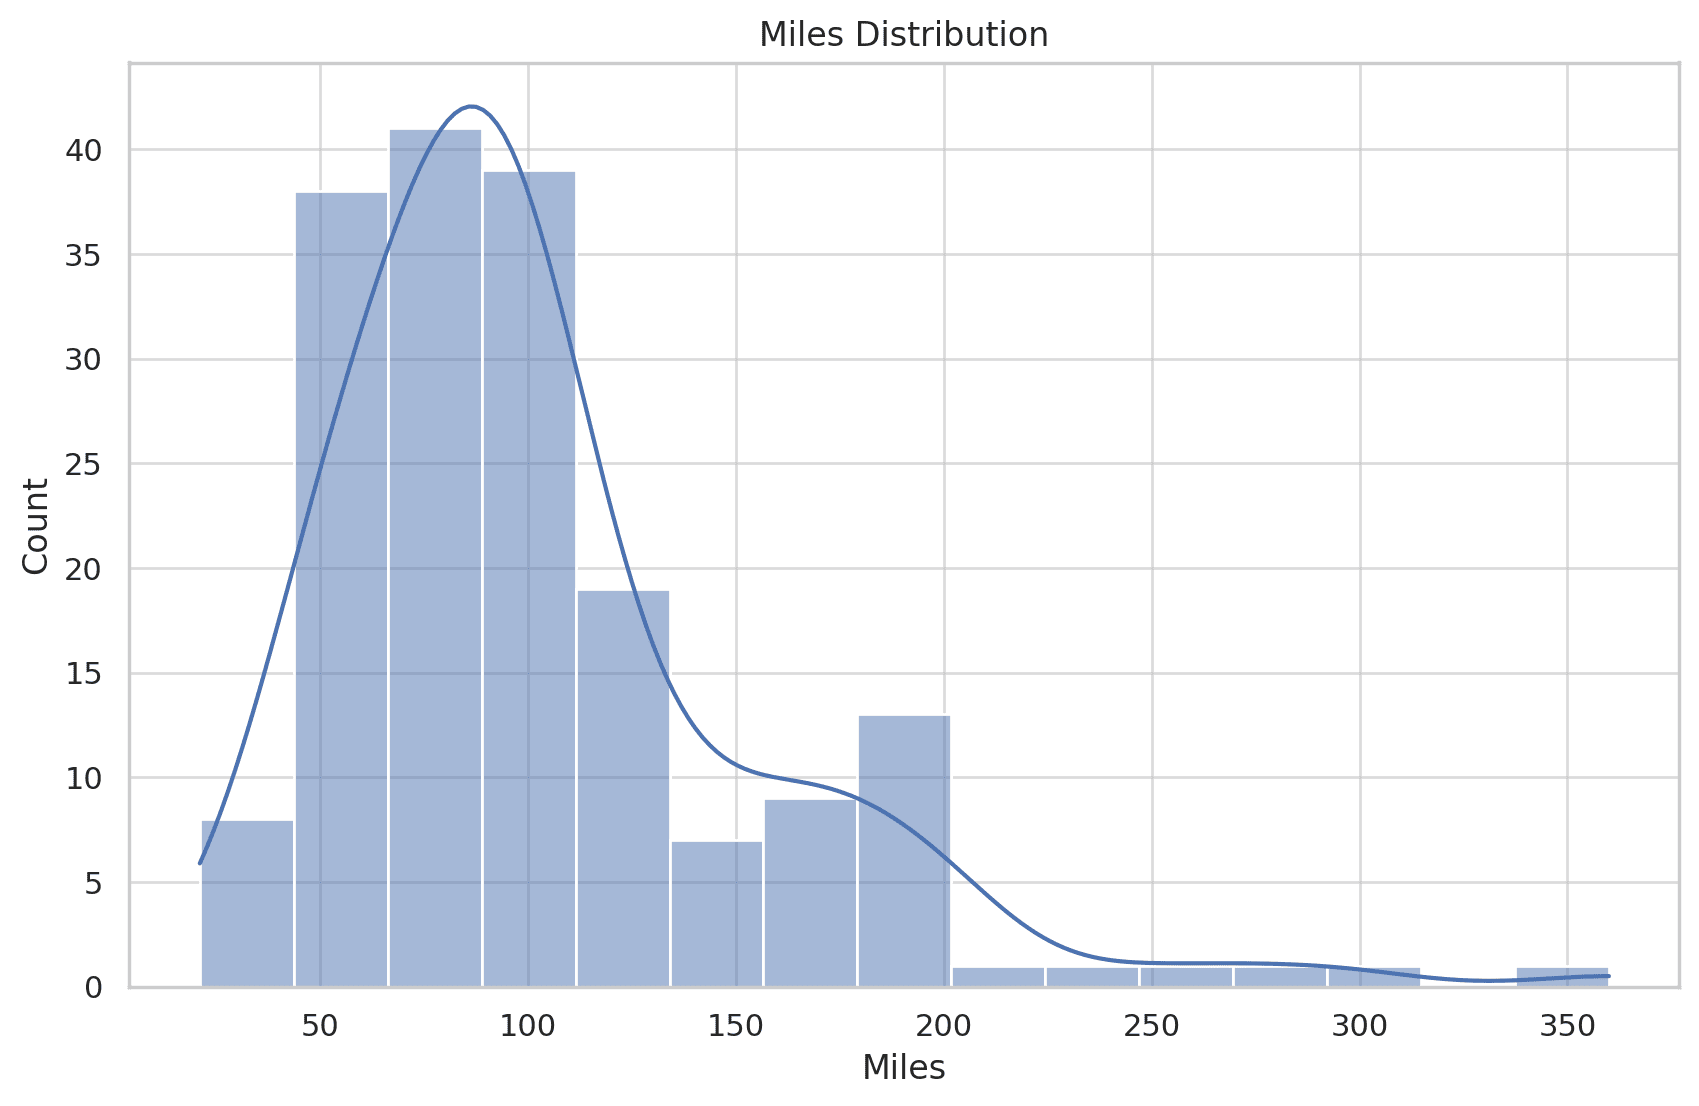
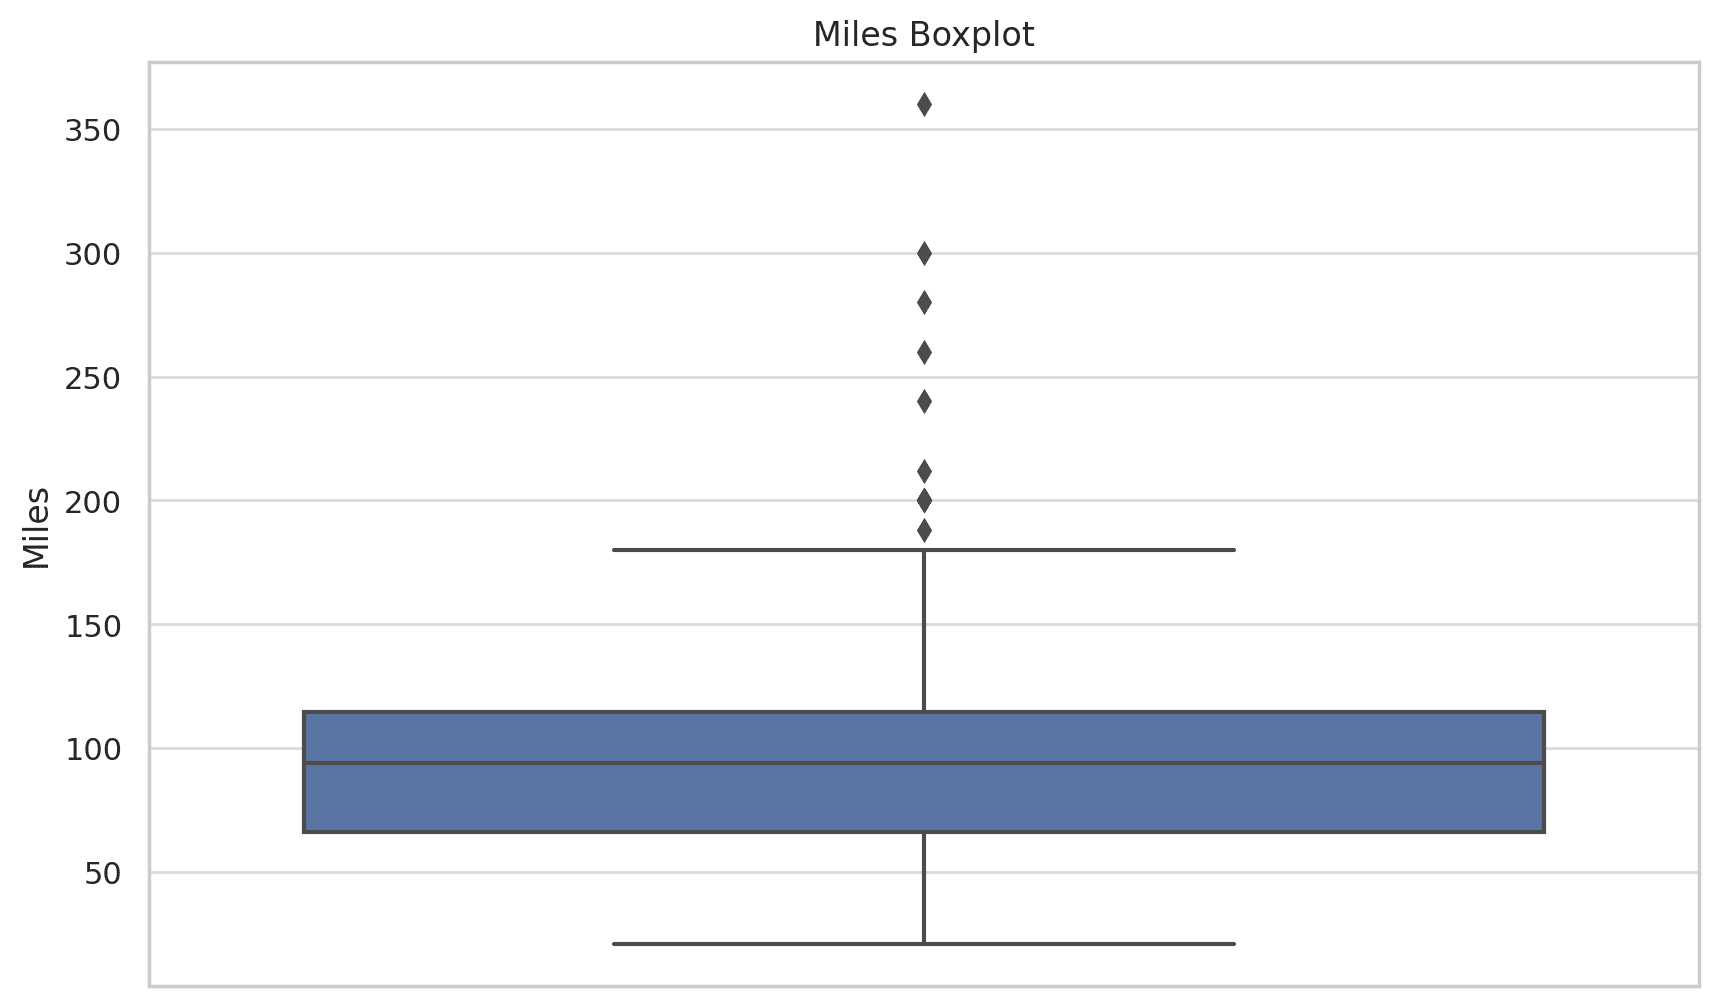
It creates histograms and box plots for key variables: Age, Income, and Miles. It detected possible outliers in the Income and Miles distribution.

Created by Author/ChatGPT
Created by Author/ChatGPT
It also interprets the visualizations. So, it notices that the distribution of income is right-skewed, which indicates that most customers have an income on the lower end of the spectrum, and fewer customers earn significantly higher incomes. The boxplot suggests there are some outliers on the higher end.
Created by Author/ChatGPT
Created by Author/ChatGPT
The same interpretation is applicable to the Miles distribution: right-skewed and outliers on the higher end.
Considering the nature of the data, it suggests that these outliers are not necessarily errors but rather represent a specific customer segment. Regarding the skewed distributions, it suggests transformations (e.g., log transformation) to normalize the data.
Of course, you can also ask it to write a Python code for these visualizations.
Great: Validate Data Suitability for Specific Statistical Tests
I can use the same data and ask ChatGPT if it’s suitable for logistic regression. And if not, what should I do to transform it so it’s appropriate?
It replied that my data is primarily suited for descriptive and inferential analysis of continuous data.
These are the suggested ways of transforming data for logistic regression.
Create a Binary Outcome: Create a binary outcome by categorizing customers as “high usage” or “low usage based on a median split on the Usage variable. Also, the binary outcome can be “treadmill purchase” vs. “no treadmill purchase”.
Check for Multicolinearity: Use a correlation matrix or Variance Inflation Factor (VIF) to check for multicolinearity. If there’s multicollinearity, the correlated variables can be removed or combined.
Feature Scaling: While feature scaling for model fitting is not necessary for logistic regression, it can be beneficial for convergence. This is the case especially for features with significantly different scales.
Tackling Non-Linearity: The transformations, such as log or square root, can be used for variables that do not satisfy the linearity assumption.
Sample Size: The dataset has to be large enough given the number of predictor variables.
Data Preprocessing: Handling outliers and categorical variables (by one-hot encoding or label encoding) is suggested. Additionally, it suggests handling missing values, but this doesn’t apply to my data, as there are no missing values.
Good: Automate Parts or the Whole Data Science Project
ChatGPT can actually be helpful in every stage of a data science project. You can prompt it to write a web scraping code. You can instruct it to explore and prepare your data for the machine learning algorithms. It can also give you a code for choosing the right algorithm, dataset splitting, A/B testing, and performance-boosting algorithms. Finally, you can also ask ChatGPT to write you a code for model deployment.
While ChatGPT can do all that, it’s quite possible that you won’t immediately get a code that does exactly what you want. So, you have to understand what you want to achieve and check the code. The chance is you’ll have to prompt ChatGPT for code corrections and provide more instructions on what to change.
Good: Code Converting and Learning
ChatGPT can help users who are still learning new coding languages. Imagine that you’re an SQL master, and you have no problems solving this interview question. However, you want to add Python to your skills. ChatGPT can help you with that. You can copy the SQL code and ask ChatGPT to convert it to Python.
So, the SQL code is this.
SELECT
  company,
  profit
FROM
  (
    SELECT
      *,
      rank() OVER (
        ORDER BY
          profit DESC
      ) as rank
    FROM
      (
        SELECT
          company,
          sum(profits) AS profit
        FROM
          forbes_global_2010_2014
        GROUP BY
          company
      ) sq
  ) sq2
WHERE
  rank <= 3;
ChatGPT wrote the Python code based on the SQL code above, but it doesn’t work right. So I engage in bashing ChatGPT for not writing the correct code. And I ask it to try again, since the output is not the same as with SQL code. It tries again and returns the correct result.
import pandas as pd

# Assuming 'forbes_global_2010_2014' is a pandas DataFrame with columns 'company' and 'profits'
# Since we don't have the actual data, this code assumes that the DataFrame is already loaded

# Step 1: Group by company and sum the profits
company_profits_sum = forbes_global_2010_2014.groupby('company')['profits'].sum().reset_index()

# Step 2: Rank the companies by profit in descending order
company_profits_sum['rank'] = company_profits_sum['profits'].rank(ascending=False, method='max')

# Step 3: Filter the top 3 companies
top_companies = company_profits_sum[company_profits_sum['rank'] <= 3]

# Final selection of columns
result = top_companies[['company', 'profits']].sort_values('profits', ascending=False)

result  # This will display the top 3 companies by profit
As you can see, you get a nice code with comments before each code block. To improve your learning, you can ask it to interpret this code. That way, you’ll get even deeper into what each code line does and how.
Bad: Statistical and Mathematical Calculations
When I say bad, I mean really bad! It goes to the level where it uses the right formula and plugs in the right values but somehow manages to mess up not-that-complicated calculations.
Have a look at this. I asked it to solve this problem: “Suppose you roll a fair six-sided die 10 times. What is the probability of rolling two 1s, three 2s, one 3, zero 4s, three 5s, and one 6?”
It computes the probability this way.
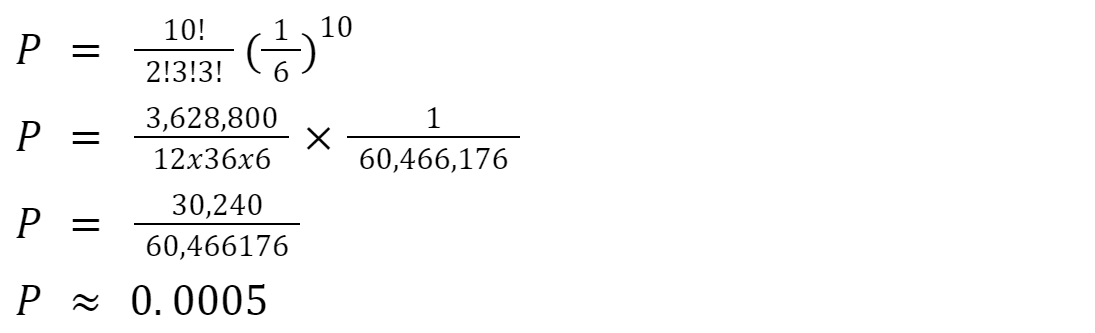
It messes up when calculating factorials. And it does that with style! Completely wrong saying 2! = 12. It’s not, it’s 2. How can you mess up a simple calculation such as 2x1 = 2? This is really laughable!
Even funnier is that once, 3! = 36, and the second time 3! = 6. Credit to it, as it was correct once at least.
When I ask it to correct the calculation without further explanation, it calculates again and comes up with the probability of 0.0001389. I couldn’t believe my eyes! It can use precisely the same formula and values and come up with a different result that is still wrong!
I asked it again to correct the calculation, and it finally returned the correct result: 0.0008336. The third time is a charm!
Admittedly, these mistakes were made by ChatGPT 3.5. I asked ChatGPT 4 the same question, and it came up with the correct calculation on the first try. You might also use some mathematical plug-ins to stay on the safe side.
Conclusion
The main learning from all this is that ChatGPT is a bad master but a very good servant. It can be helpful in writing code, debugging, analyzing, and visualizing data. However, never trust it completely and never take what it writes without scrutiny.
Check the code it writes, and check the calculations. You’re a data scientist, after all, and ChatGPT is not! You might not get the desired results from ChatGPT on the first try. But giving it more precise instructions and trying several times will probably get you to the desired result.
Nate Rosidi is a data scientist and in product strategy. He's also an adjunct professor teaching analytics, and is the founder of StrataScratch, a platform helping data scientists prepare for their interviews with real interview questions from top companies. Nate writes on the latest trends in the career market, gives interview advice, shares data science projects, and covers everything SQL.