A Beginner’s Guide to Neural Networks with R!
In this article we will learn how Neural Networks work and how to implement them with the R programming language! We will see how we can easily create Neural Networks with R and even visualize them. Basic understanding of R is necessary to understand this article.
By Jose Portilla, Udemy Data Science Instructor.
I'm Jose Portilla and teach thousands of students on Udemy about Data Science and Programming and I also conduct in-person programming and data science training. Check out the end of the article for discount coupons on my courses!
Neural Networks
Neural Networks are a machine learning framework that attempts to mimic the learning pattern of natural biological neural networks. Biological neural networks have interconnected neurons with dendrites that receive inputs, then based on these inputs they produce an output signal through an axon to another neuron. We will try to mimic this process through the use of Artificial Neural Networks (ANN), which we will just refer to as neural networks from now on. The process of creating a neural network begins with the most basic form, a single perceptron.
The Perceptron
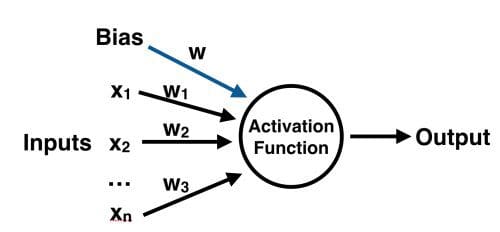
Let's start our discussion by talking about the Perceptron! A perceptron has one or more inputs, a bias, an activation function, and a single output. The perceptron receives inputs, multiplies them by some weight, and then passes them into an activation function to produce an output. There are many possible activation functions to choose from, such as the logistic function, a trigonometric function, a step function etc. We also make sure to add a bias to the perceptron, this avoids issues where all inputs could be equal to zero (meaning no multiplicative weight would have an effect). Check out the diagram below for a visualization of a perceptron:
Once we have the output we can compare it to a known label and adjust the weights accordingly (the weights usually start off with random initialization values). We keep repeating this process until we have reached a maximum number of allowed iterations, or an acceptable error rate.
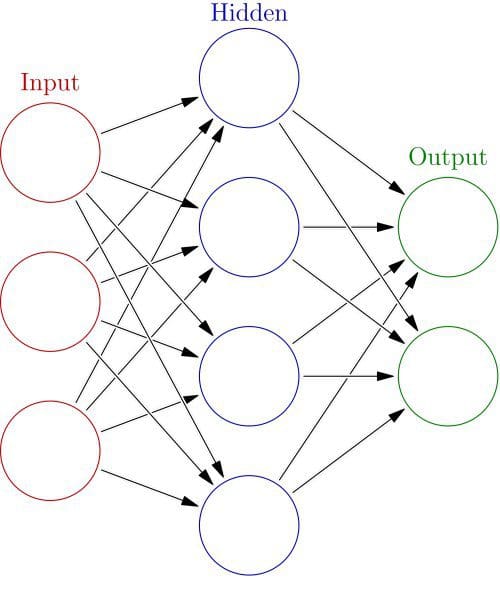
To create a neural network, we simply begin to add layers of perceptrons together, creating a multi-layer perceptron model of a neural network. You'll have an input layer which directly takes in your feature inputs and an output layer which will create the resulting outputs. Any layers in between are known as hidden layers because they don't directly "see" the feature inputs or outputs. For a visualization of this check out the diagram below (source: Wikipedia).
Let's move on to actually creating a neural network in R!
Data
We'll use ISLR's built in College Data Set which has several features of a college and a categorical column indicating whether or not the School is Public or Private.
#install.packages('ISLR')
library(ISLR)

print(head(College,2))
                             Private Apps Accept Enroll Top10perc Top25perc
Abilene Christian University     Yes 1660   1232    721        23        52
Adelphi University               Yes 2186   1924    512        16        29
                             F.Undergrad P.Undergrad Outstate Room.Board Books
Abilene Christian University        2885         537     7440       3300   450
Adelphi University                  2683        1227    12280       6450   750
                             Personal PhD Terminal S.F.Ratio perc.alumni Expend
Abilene Christian University     2200  70       78      18.1          12   7041
Adelphi University               1500  29       30      12.2          16  10527
                             Grad.Rate
Abilene Christian University        60
Adelphi University                  56
Data Preprocessing
It is important to normalize data before training a neural network on it. The neural network may have difficulty converging before the maximum number of iterations allowed if the data is not normalized. There are a lot of different methods for normalization of data. We will use the built-in scale() function in R to easily accomplish this task.
Usually it is better to scale the data from 0 to 1, or -1 to 1. We can specify the center and scale as additional arguments in the scale() function. For example:
# Create Vector of Column Max and Min Values
maxs <- apply(College[,2:18], 2, max)
mins <- apply(College[,2:18], 2, min)

# Use scale() and convert the resulting matrix to a data frame
scaled.data <- as.data.frame(scale(College[,2:18],center = mins, scale = maxs - mins))

# Check out results
print(head(scaled.data,2))
                                      Apps        Accept        Enroll
Abilene Christian University 0.03288692646 0.04417701272 0.10791253736
Adelphi University           0.04384229271 0.07053088583 0.07503539405
                                Top10perc    Top25perc   F.Undergrad
Abilene Christian University 0.2315789474 0.4725274725 0.08716353479
Adelphi University           0.1578947368 0.2197802198 0.08075165058
                               P.Undergrad     Outstate   Room.Board
Abilene Christian University 0.02454774445 0.2634297521 0.2395964691
Adelphi University           0.05614838562 0.5134297521 0.7361286255
                                    Books     Personal          PhD
Abilene Christian University 0.1577540107 0.2977099237 0.6526315789
Adelphi University           0.2914438503 0.1908396947 0.2210526316
                                  Terminal    S.F.Ratio perc.alumni
Abilene Christian University 0.71052631579 0.4182305630      0.1875
Adelphi University           0.07894736842 0.2600536193      0.2500
                                   Expend    Grad.Rate
Abilene Christian University 0.0726714046 0.4629629630
Adelphi University           0.1383867137 0.4259259259