Visualizing Cross-validation Code
Cross-validation helps to improve your prediction using the K-Fold strategy. What is K-Fold you asked? Check out this post for a visualized explanation.
By Sagar Sharma, Machine Learning & Programming Aficionado.
Let’s visualize to improve your prediction...
Let us say, you are writing a nice and clean Machine Learning code (e.g. Linear Regression). You code is OK, first you divided your dataset into two parts, "Training Set and Testing Set" as usual with the function like train_test_split and with some random factor. Your prediction could be slightly under or overfit, like the figures below.
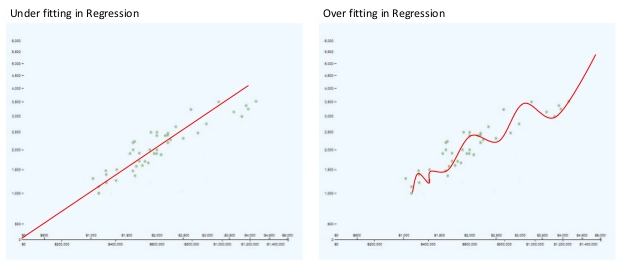
Fig: Under and Over-Fit Prediction
and the results are not changing. So what can we do?
As the name of the suggests, cross-validation is the next fun thing after learning Linear Regression because it helps to improve your prediction using the K-Fold strategy. What is K-Fold you asked? Everything is explained below with Code.
The Full Code :)
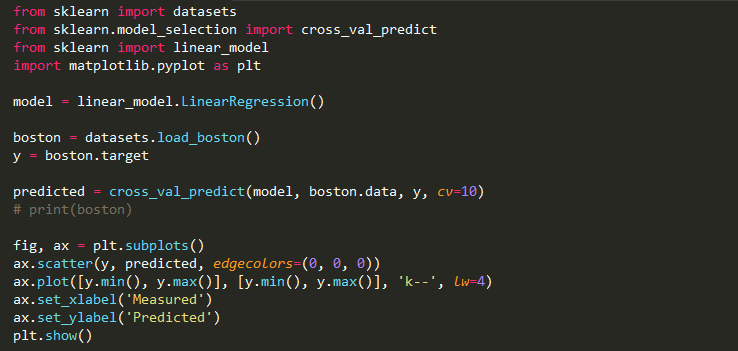
Fig:- Cross Validation with Visualization
Code Insight:
The above code is divided into 4 steps...
1. Load and Divide target dataset.
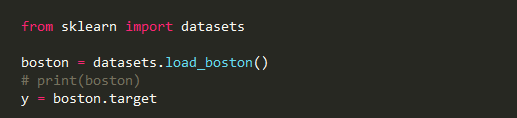
Fig:- Load the dataset
We are copying the target in dataset to y variable. To see the dataset uncomment the print line.
2. Model Selection
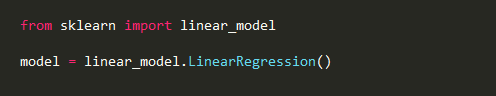
Fig:- Model Selection (LinearRegression())
Just to make things simple we will use Linear Regression. To learn about it more click on “Linear Regression: The Easier Way” Post.
3. Cross-Validation :)
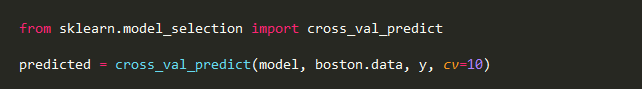
Fig:- Cross Validation in sklearn
It is a process and also a function in the sklearn
cross_val_predict(model, data, target, cv)
where,
- model is the model we selected on which we want to perform cross-validation
- data is the data.
- target is the target values w.r.t. the data.
- cv (optional)is the total number of folds (a.k.a. K-Fold ).
In this process, we don’t divide the data in two sets like usual (training and test set) like shown below.
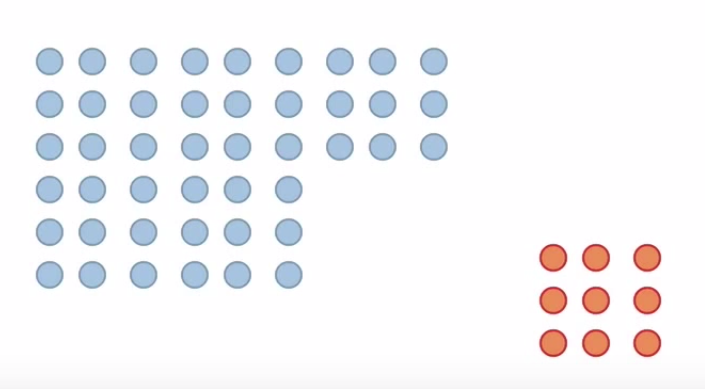
Fig:- Train set (Blue)and Test set (Red)
But we divide the dataset into equal K parts (K-Folds or cv). To improve the prediction and to generalize better. Then train the model on the bigger dataset and test on the smaller dataset. Let us say the cv is 6.
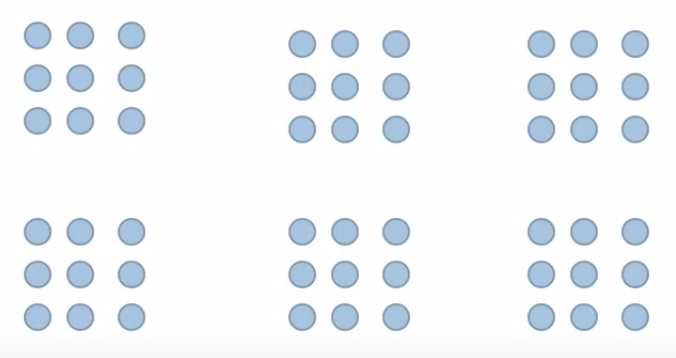
Fig:- 6 equal folds or parts
Now, the first iteration of model splitting will look something like this where Red is test & Blue is Train data.
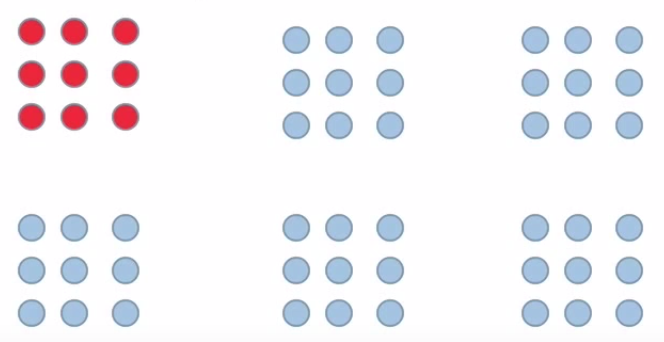
Fig:- cross_val first iteration
The second iteration will look like the Figure below.
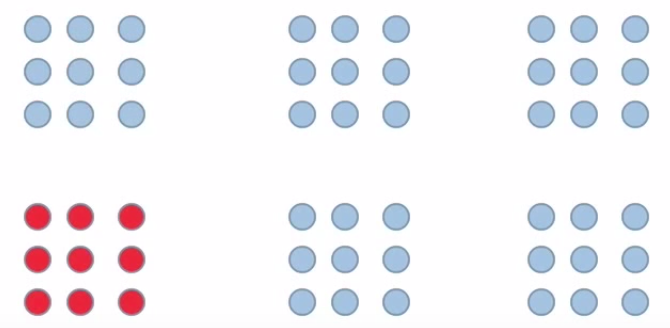
Fig:- cross_val second iteration
and so on till the last or 6th iteration that will look something like this figure below.
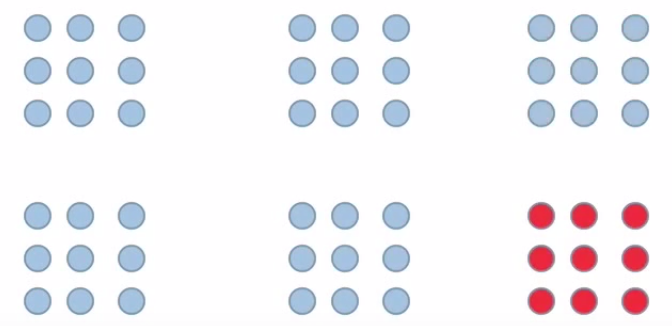
Fig:- cross_val sixth iteration
4. Visualize the Data with Matplotlib
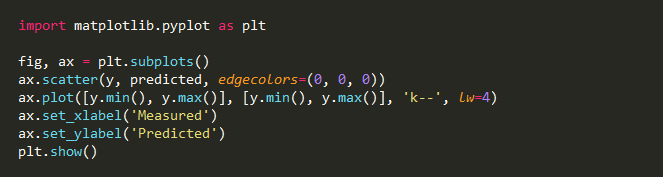
Fig:- Visualize with Matplotlib
For visualisation we are importing matplotlib library. Then making a subplot.
Creating scatter points with black (i.e(0,0,0)) outline or edgecolors.
Using ax.plot to give minimum & maximum values for both axis with 'k--' representing the type of line with the line width i.e. lw = 4.
Next, giving label to x and y axis.
plt.show() at last to show the graph.
The Result
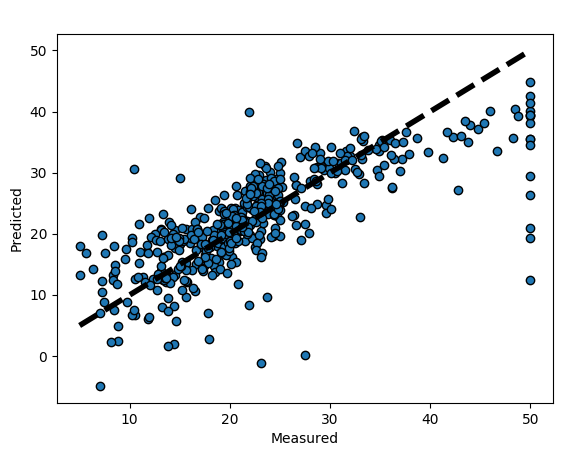
Fig:- Prediction
This graph represents the k- folds Cross Validation for the Boston dataset with Linear Regression model.
I’m sure there many types of cross validation that people implement but K-folds is a good and an easy type to start from.
To get the full code go to this github link: Github
Follow me on Medium to get similar posts.
I will be posting 2 posts per week so don’t miss the Code tutorial.
Contact me on Facebook, Twitter, Linkedin, Google+.
Any comments or if you have any question, write it in the comment.
Clap it! Share it! Follow Me !
Happy to be helpful. kudos...
Bio: Sagar Sharma (@SagarSharma244) is interested in Programming (Python, C++), Arduino, Machine learning :). He also likes to write stuff.
Original. Reposted with permission.
Related: