Top 10 Data Visualization Projects on Github
Github provides a number of open source data visualization options for data scientists and application developers integrating quality visuals. This is a list and description of the top project offerings available, based on the number of stars.
Open source tools have been used by 73% of data scientists in the past 12 months. While the most recent KDnuggets software poll results do not specifically account for data visualization tools, it is reasonable to believe that similar numbers extend to this dimension of data science, especially given all of the great open source options available today.
There is no question that data visualization is an important piece of the data science puzzle. While a host of commercial options are available to data scientists for preparing visualizations for sharing and explaining data stories, open source tools are catching up to their closed source counterparts.
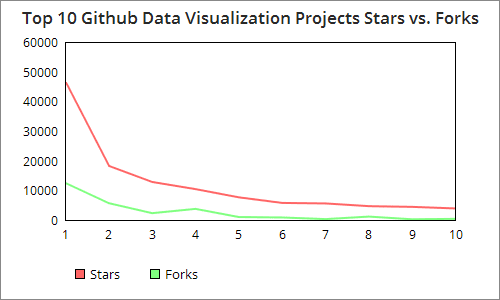
The following list is composed of the top 10 projects appearing in the Github Data Visualization Project Showcase*. Note from the start that a majority (all?) of these projects are in the JavaScript ecosystem. If you are more interested in Python visualization tools, please see the related posts.
1. D3
Stars: 46561, Forks: 12465
D3 is a JavaScript data visualization library for HTML and SVG. It aims to brings data to life, and emphasizes web standards, combining powerful visualization techniques with a data-driven approach to Document Object Model (DOM) manipulation. D3 is the most popular data visualization project on Github by a wide margin, and is well-represented in the data science community.
2. Chart.js
Stars: 18244, Forks: 5670
Chart.js is an HTML5 library that brings visualization via the <canvas> element. Chart.js promotes itself as simple & flexible, is interactive, and supports 6 different chart types.
3. Leaflet
Stars: 12822, Forks: 2305
Leaflet is a JavaScript library for the creation of mobile-friendly interactive maps. Its code is incredibly small, and Leaflet is designed with the goals of simplicity, performance, and usability. Doesn't have the functionality you want out of the box? Leaflet is also extensible via a whole host of plugins.
4. ECharts
Stars: 10409, Forks: 3745
ECharts is a browser-based charting and visualization library. Like other libraries on this list, it aims to be easy to use and flexible, as well as intuitive and highly customizable. Also like many others, ECharts is a JavaScript library; however, it is based on zrender, an original canvas library designed for 2D charts.
5. Chartist-js
Stars: 7645, Forks: 1000
Chartist is... it's becoming a bit repetitive at this point. JavaScript. Check. Lightweight. Check. And this is not a knock on Chartist; most of these libraries are just very similar, at least at their core. Chartist sets itself apart, however, in the following manner: Chartist does not rely on canvas, and puts an emphasis on responsiveness. It also (as per its own description) tries to be less annoying than other options.
6. Sigma.js
Stars: 5757, Forks: 851
Sigma is a JavaScript library which focuses on graph drawing. Sigma allows developers to develop graph representations on webpages, and integrate these networks into web applications. The resulting networks are attractive, and support interaction.
Stars: 5582, Forks: 302
MetricsGraphics.js is, you guessed it, a JavaScript library, which is built on top of D3, another JavaScript library. MetricsGraphics is optimized for time-series data, which is a differentiating aspect. It's code base is particularly small, forcing it to be principled. A number of standard graphic types are supported, including line charts, scatterplots, histograms, bar charts and more.
8. DC.js
Stars: 4661, Forks: 1149
DC.js is dimensional charting built on D3.js to work natively with crossfilter. DC.js renders in CSS friendly SVG format. It is meant for powerful data analysis in the browser as well as on the mobile device.
9. Epoch
Stars: 4426, Forks: 239
Epoch is a general purpose library for developers and visualization designers. It is general purpose, and supports 2 distinct aspects of visualization: basic charts for historical data reporting, and real-time charts for displaying frequently updating time-series data. Epoch is a JavaScript project.
10. Vega
Stars: 3896, Forks: 389
Vega is a visualization grammar. Vega provides a manner for creating and saving interactive visualization designs, in a declarative format. Data visualizations are described in JSON format. Interactive views are generated using either HTML5 Canvas or SVG.
These projects are predominantly JavaScript-based, and as such are geared toward web development and browser-based data visualization. There is no doubt that this is an increasingly-important aspect of data viz, and data science in general. If you are interested in Python visualization tools, see the related items below.
*Based on the highest number of stars, viewed February 17, 2016 @ 8:00 PM.
Related: