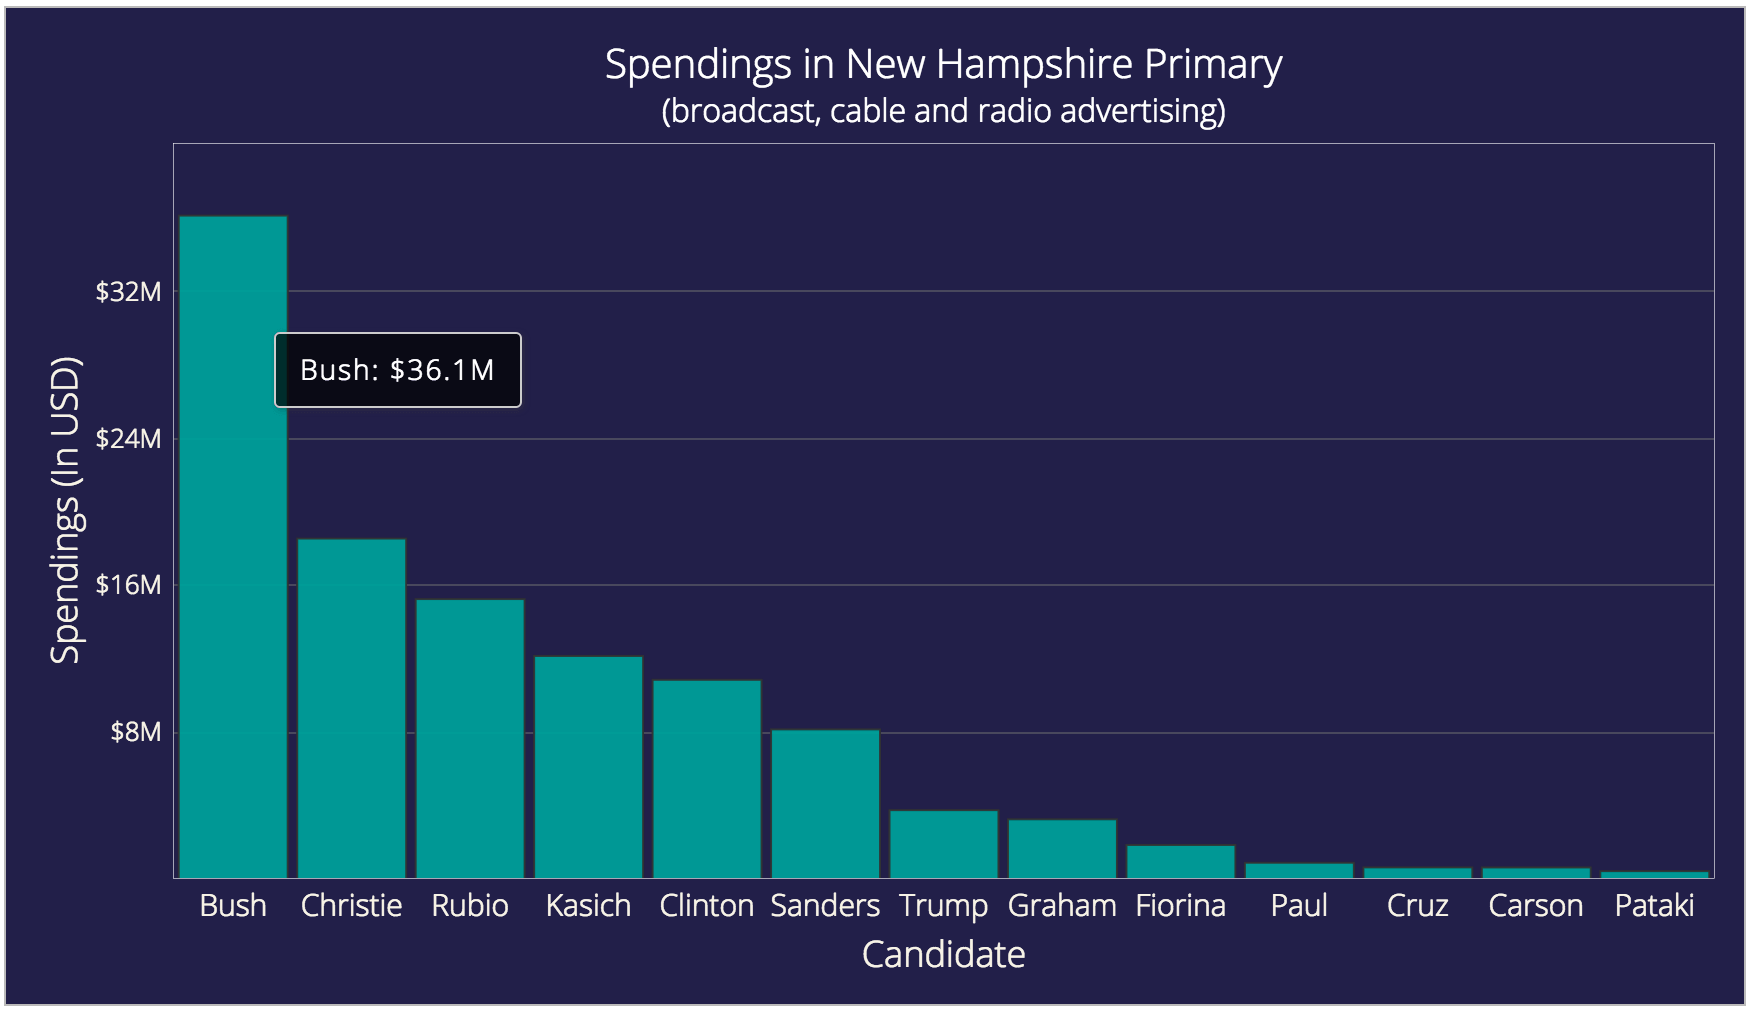
Dynamic Data Visualization with PHP and MySQL: Election Spending
Learn how to fetch data from MySQL database using PHP and create dynamic charts with that data, using an interesting example of New Hampshire primary election spending.
By Rohit Boggarapu, @4two2.
In my last two articles I used only client-side technologies – JavaScript and jQuery – to create interactive charts. But more often than not the data you want to visualize is present in a database, and server-side code is needed to handle that. You need some sort of a way to pull that data directly from the database and feed it into the charting library for plotting a chart.
Today, I am going to solve exactly this problem. I will use PHP to pull data from a MySQL database and create an interactive chart using that data. For creating charts, I will use FusionCharts’ core JavaScript chart library and its PHP charts wrapper.
This is what we are creating today (download source code from here):
Given below is the six step process that I will be following to create the above chart:
- Including project dependencies
- Initiating and validating database connection
- Writing SQL query for fetching data
- Converting query result into JSON
- Creating chart instance and closing the DB connection
Step-1: Including Project Dependencies
As mentioned above, we need to include two dependencies for our project. Here’s how we do it:
Get PHP charts wrapper and include it in your PHP code like this:
<?php
    //Including FusionCharts’ PHP Wrapper
    include("fusioncharts.php");
?>
Download and include the core JavaScript charts file in HTML like this:
<!-- Including FusionCharts JavaScript file -->
<script type="text/javascript" src="fusioncharts.js"></script>
Step-2: Initiating and Validating Database Connection
Once we have got all the dependencies included in our code, we need to initiate the connection with the DB and validate it before we start fetching data.
Here is the code to do that:
<?php

    // setting up connection with database
    $hostdb="localhost"; // MySQL host server
    $userdb="db_username"; // MySQL database username
    $passdb="db_password"; // MySQL password
    $namedb="db_name"; // name of database

?>
Just replace values for $hostdb, $userdb, $passdb, and $namedb with your MySQL database’s actual values in the above code.
Before we try to fetch the data from database, we need to validate our connection. Here’s how we do it:
$dbhandle = new mysqli($hostdb, $userdb, $passdb, $namedb);

if ($dbhandle -> connect_error) {
    exit("There was an error with your connection: ".$dbhandle ->
connect_error);
}
$dbhandle is used to establish connection with the database. If there is any problem while establishing the connection, above code will throw an error message.
Note: You can also create a separate .php file for this step and include it instead of writing it every time.
Step-3: Writing SQL Query for Fetching Data
Now that we have made sure we are connected to the database, we can move on to writing the SQL query to fetch the data for our chart:
$sqlQuery = "SELECT DISTINCT candidate,
 expenditure FROM electionexpense_data; ";

$result = $dbhandle->query($sqlQuery) or
exit("Error code ({$dbhandle->errno}): {$dbhandle->error}");
After the above query is executed, $result variable will hold the data from MySQL database which we are going to use in the next step.