How to Compute the Statistical Significance of Two Classifiers Performance Difference
To determine whether a result is statistically significant, a researcher would have to calculate a p-value, which is the probability of observing an effect given that the null hypothesis is true. Here we are demonstrating how you can compute difference between two models using it.
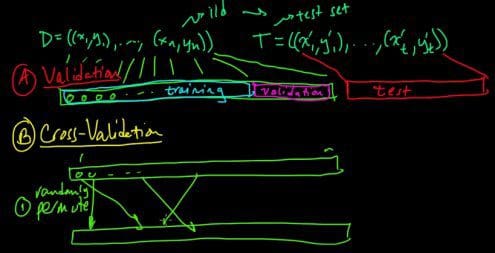
Let us assume that we have two classifiers, C1 and C2, applied to a dataset, and we apply 25-fold cross validation to the dataset. Thus, for classifier C1:
- We reserve the first subset as a testset, and use the remaining 24 subsets to train the model for the C1 classifier.
- Then, we reserve the 2nd subset as a testset, and use the remaining 24 subsets to train the model for classifier C1.
- We repeat another 23 times, and then average the results.
We repeat the above procedure for classifier C2. Let us denote by E1j and E2j, the error rates for the jth fold for classifiers C1 and C2 respectively. As a reminder, the error rate of a classifier is the ratio of wrong predictions to the total number of predictions. Let us denote as Dj, the error rate difference for the jth fold:
Dj=E1j-E2j
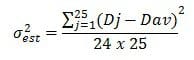
Let us also denote as Dav the average error rate difference, averaged over all folds. An important note here is that the number of folds has to be large enough (minimum 25-30), in order for Dj to be normally distributed with mean DTRUE. As described in [1], the variance of the observed difference can be computed as:
while the confidence interval of DTRUE is computed as:

where t(1-a)24 is the t distribution coefficient that can be found from a lookup table, and depends on the confidence level and the number of folds. For illustration purposes, let us assume that Dav is 0.004 and σest is 0.003. For a confidence level of 95% and 25 folds, the lookup table in chapter 4.6.3 of [1] yields:
t(1-a)24=2.06
Then, the confidence interval for our example becomes:
DTRUE=0.004⩲0.003×2.06
The confidence interval spans 0, thus the observed performance difference is NOT statistically significant.
REFERENCES
[1] Tan, P.N., Steinbach, M. and V. Kumar, “Introduction to Data Mining” ,Pearson, 2005.
BIO: Theophano Mitsa holds a Ph.D. degree in EE from the U. of Rochester and is the author of 47 publications, 11 U.S. patents and the book (CRC Press, 2010) “Temporal Data Mining”. She has diverse academic and industrial experience, having served as a faculty member at the Universities of Iowa and Massachusetts and a Senior Software Engineer at GE HealthCare and Abiomed. Dr. Mitsa has received research awards from NSF, the Whitaker Foundation and HP. She is also a Fulbright scholar and the winner of the University of Rochester Eastman Medal. She is currently an independent Machine Learning and Analytics consultant.
Related: