Would You Survive the Titanic? A Guide to Machine Learning in Python Part 1
Check out the first of a 3 part introductory series on machine learning in Python, fueled by the Titanic dataset. This is a great place to start for a machine learning newcomer.
Patrick Triest, SocialCops.
What if machines could learn?
This has been one of the most intriguing questions in science fiction and philosophy since the advent of machines. With modern technology such questions are no longer bound to creative conjecture, machine learning is all around us. From deciding which movie you might want to watch next on Netflix to predicting stock market trends, machine learning has a profound impact on how data is understood in the modern era.
This tutorial aims to give an accessible introduction to how to use machine learning techniques for your own projects and datasets. In just 20 minutes, you will learn how to use Python to apply different machine learning techniques, from decision trees to deep neural networks, to a sample dataset. This is practical, not a conceptual, introduction; to fully understand the capabilities of machine learning I highly recommend that you seek out resources that explain the low level implementations of these techniques.
For our sample dataset: passengers of the RMS Titanic. We will be using a open dataset that provides data on the passengers aboard the infamous doomed sea voyage of 1912. By examining factors such as class, sex, and age, we will experiment with different machine learning algorithms and build a program that can predict whether a given passenger would have survived this disaster.
Setting Up Your Machine Learning Laboratory
The best way to learn about machine learning will be to follow along with this tutorial on your local computer. In order to do this, you will need to install a few software packages if you do not have them yet.
- Python (version 3.4.2 was used for this tutorial)
- SciPy Ecosystem (NumPy, SciPy, Pandas, IPython, matplotlib)
- SciKit-Learn
- TensorFlow
There are multiple options for how to install each of these packages. I recommend using the “pip” Python package manager, which will allow you to simply run “pip3 install
For actually writing and running the code I recommend using IPython, which will allow you to run modular blocks of code and immediately the view output values and data visualizations, along with the Jupyter Notebook as a graphical interface.
You will also need the Titanic dataset that we will be analyzing, which you can find here: biostat.mc.vanderbilt.edu/wiki/pub/Main/DataSets/titanic3.xls
The Data At First Glance: Who Survived The Titanic, And Why?
First import the required Python dependencies.
import matplotlib.pyplot as plt
%matplotlib inline
import random
import numpy as np
import pandas as pd
from sklearn import datasets, svm, cross_validation, tree, preprocessing, metrics
import sklearn.ensemble as ske
import tensorflow as tf
from tensorflow.contrib import skflow
Once we have read the spreadsheet file into a Pandas dataframe(imagine a hyperpowered Excel table), we can peek at the first five rows of data using the head() command.
titanic_df = pd.read_excel('titanic3.xls', 'titanic3', index_col=None, na_values=['NA'])
titanic_df.head()
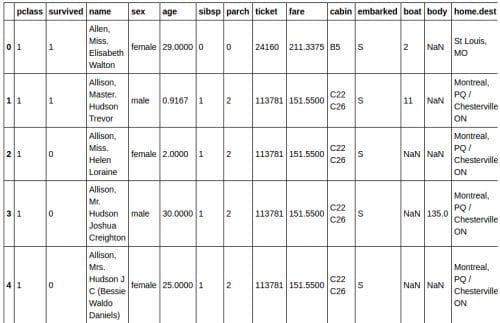
The column heading variables have the following meanings:
- survival - Survival (0 = No; 1 = Yes)
- class - Passenger Class (1 = 1st; 2 = 2nd; 3 = 3rd)
- name - Name
- sex - Sex
- age - Age
- sibsp - Number of Siblings/Spouses Aboard
- parch - Number of Parents/Children Aboard
- ticket - Ticket Number
- fare - Passenger Fare
- cabin - Cabin
- embarked - Port of Embarkation (C = Cherbourg; Q = Queenstown; S = Southampton)
- boat - Lifeboat (if survived)
- body - Body number (if did not survive and body was recovered)
Now that we have the data in a dataframe, we can begin performing advanced analysis of the data using powerful single-line Pandas functions. First let’s examine the overall chance of survival for a Titanic passenger.
titanic_df['survived'].mean()

# 0.3819709702062643
The calculation shows that only 38% of the passengers survived. Not the best odds. The reason for this massive loss of life is that the Titanic was only carrying 20 lifeboats, which was not nearly enough for the 1,317 passengers and 885 crew members aboard. It seems unlikely that all of the passengers would have had equal chances at survival, so we will continue breaking down the data to examine the social dynamics that determined who got a place on a lifeboat and who did not.
Social classes were heavily stratified in the early 20th, and this was especially true on the Titanic where the luxurious 1st class areas were completely off limits to the middle-class passengers of 2nd class, and especially to those who carried a 3rd class “economy price” ticket. To get a view into the composition of each class, we can group data by class, and view the averages for each column:
titanic_df.groupby('pclass').mean()
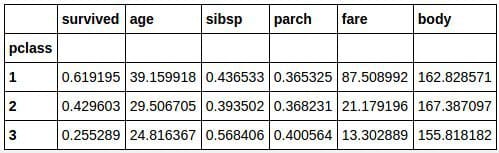
We can start drawing some interesting insights from this data. For instance, passengers in 1st class had a 62% chance of survival, compared to a 25.5% chance for those in 3rd class. Additionally, the lower classes generally consisted of younger people, and the ticket prices for first class were predictably much higher than those for second and third class. The average ticket price for first class, £87.5, is equivalent to $13,487 in 2016.
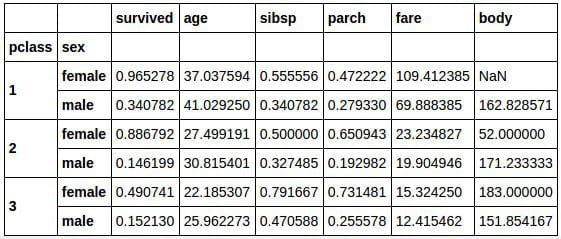
We can extend our statistical breakdown using the grouping function for both class and sex:
class_sex_grouping = titanic_df.groupby(['pclass','sex']).mean()
class_sex_grouping
class_sex_grouping['survived'].plot.bar()
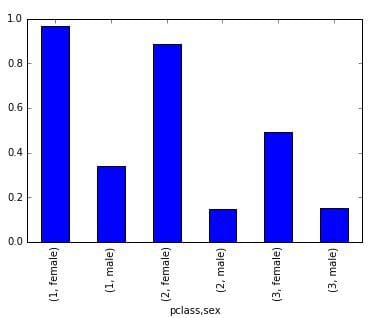
While the Titanic was sinking, the officers famously prioritized who was allowed in a lifeboat with the strict maritime tradition of evacuating women and children first. Our statistical results clearly reflect the first part of this policy, as across all classes women were much more likely to survive than the men. We can also see that the women were younger than the men on average, were more likely to be travelBio: Patrick is a 23 year old Android Developer / IoT Engineer / Data Scientist / wannabe pioneer, originally from Boston and now working at SocialCops. He’s addicted to learning, and sometimes after figuring out something particularly cool he gets really excited and writes about iting with family, and paid slightly more for their tickets.
The effectiveness of the second part of this “Women and children first” policy can be deduced by breaking down the survival rate by age.
group_by_age = pd.cut(titanic_df["age"], np.arange(0, 90, 10))
age_grouping = titanic_df.groupby(group_by_age).mean()
age_grouping['survived'].plot.bar()
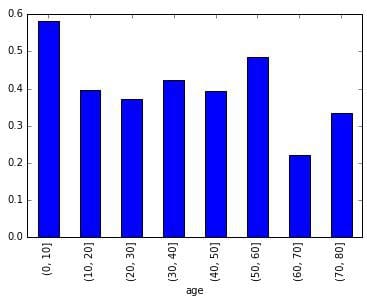
Here we can see that children were indeed the most likely age group to survive, although this percentage was still tragically below 60%.
 Bio: Patrick Triest is a 23 year old Android Developer / IoT Engineer / Data Scientist / wannabe pioneer, originally from Boston and now working at SocialCops. He’s addicted to learning, and sometimes after figuring out something particularly cool he gets really excited and writes about it.
Original. Reposted with permission.
Related: