Bad Data + Good Models = Bad Results
No matter how advanced is your Machine Learning algorithm, the results will be bad if the input data
is bad. We examine one popular IMDB dataset and discuss how an analyst can deal with such data.
By Kaiser Fung.
One of the key themes in Numbersense is the relationship between models and data. Think of data as inputs to models which generate outputs (predictions, etc.). A lot of the dialog in the data science community revolves around models, or algorithms that implement underlying models (random forests, deep learning, etc.). But there are countless examples of applying good models to bad data, resulting in bad outputs.
I just finished teaching a class about Analytical Models at Columbia. Ironically, the main takeaway for the class is grasping the complete analytical process, from data gathering to interpreting model outputs, of which the nature of the analytical model plays only a minor role. The course revolves around a semester-long project. Students are asked to identify a real-world dataset to work on.
A number of students coalesced around a movie dataset, uploaded to Kaggle. The dataset includes data scraped from the IMDB website, plus a number of enhancements, such as counting the number of people in movie posters, and the number of Facebook likes of key actors in the movies. At first glance, the dataset is quite rich, and suggests that box office receipts may be predictable using the included variables.
This dataset is a great illustration of why one cannot get good outputs when the inputs are highly flawed. On closer inspection, most of the variables contain considerable impurities. There will be three or four posts discussing various aspects of this dataset, of which this post is the first.
***
One of the most interesting variables is the count of faces (people) on the movie poster. What the analyst should recognize right away is that this variable is a “computed” variable (sometimes called “modeled”). In other words, no one actually counted the number of heads on each poster. A facial recognition algorithm developed by a third party was deployed to predict the number of heads in each poster.
We have a cascade of models. The output of one algorithm generates data which are used as input to another algorithm. With computed variables, we must ask how accurate the first algorithm is. If the first algorithm is not accurate enough, we violate one of the key assumptions of data-science models!
Most standard models used in data science, for example, regression models, assume that the predictors (X) are accurately measured. This assumption is fine when raw data are used, e.g. the budget of the movie, the year it was produced, the name of the director, etc. are all known with certainty. But here, the number of people on the poster is a prediction by the face-recognition algorithm, which does not have perfect accuracy.
The use of computed or modeled variables is extremely common in the business world. A big chunk of data we use are actually computed (aka modeled). For example, any demographic data coming from the Census files are modeled because the government does not release individual-level data. Sometimes, even gender is computed by guessing from someone’s given name.
So I asked several students to investigate the accuracy of the face-recognition algorithm. (The problem would have been obvious if the students had pulled up the IMDB pages for the first few movies in the dataset, and looked at those posters.)
***
For a more robust understanding, I randomly selected 30 movies from the set of over 5,000 movies. Then I pulled up the movie poster from each IMDB page, and counted the number of people on the poster.
In only about a third of the cases (11 out of 30) did my counts match those of the algorithm. This rate is in line with what my students reported. The accuracy is higher when there are zero or one head on the poster, and when the poster contains three or more heads, the algorithm never gets the right count in my sample. In addition, almost all the errors are under-counts (i.e. false negatives).
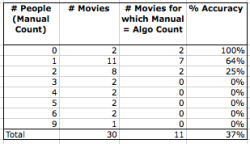
Notice that most posters show one or two people, so even an error of one head is a big deal. The average and median percentage error in the sample of 30 movies is 48% (under-counted).
Here is an example of the mis-counting. According to the algorithm, there is one person on the Better Luck Tomorrow poster (shown right). I see six faces.
***
Is this inaccurate input a big deal for predicting box office? It depends on the “theory” behind the model.  Presumably, the analyst thinks that the enthusiasm of movie-goers are affected by the number of people shown on the movie poster. The next question is whether the analyst believes this effect to be linear – does each additional person added to a poster lead to incremental enthusiasm (or loss of interest)?
While linear effects are extremely popular, the analyst has other choices. One alternative is a threshold. Perhaps there is one level of enthusiasm when the poster headcount is below X, and a different level when the headcount is above X. This suggests aggregating some of the levels of headcount. (Is there a material difference between a poster with nine heads and one with ten heads?) Aggregation has the added benefit that it is more robust to measurement errors.
***
So that is Strike #1. This is a common problem with “Big Data” datasets. In my OCCAM definition of such datasets (see here), this face count variable is an “adapted” variable coming from a third party who developed the algorithm for some other purpose. There is further trouble on the horizon if the creator of the face-recognition algorithm continues to fiddle with it. Our model if trained using the face count variable from a prior version of the algorithm will not perform well when the face count data come from a new version of that algorithm. (Recall that this was one of the reasons why Google Flu Trends failed.)
In the next post, I will discuss a different aspect of this dataset.
Original post. Reposted with permission.
Bio: Kaiser Fung is independent consultant, speaker, educator and author with extensive practical expertise in business analytics, Big Data, and data visualization. He is Director of MS in Applied Analytics at Columbia University` and author of Numbers Rule Your World: the hidden influence of probability and statistics in everything you do (McGraw-Hill, 2010), and Numbersense: how to use Big Data to your advantage (McGraw-Hill, 2013).
Related: