Business intuition in data science
Data Science projects are not just use of algorithms & building models; there are other steps of the project which are equally important. Here we explain them in detail.
By Jahnavi Mahanta.
Often when we think of a data science assignment, the main thing that comes to mind is the algorithm technique that needs to be applied. While, that is crucially important, there are many other steps in a typical data science assignment that requires equal attention.
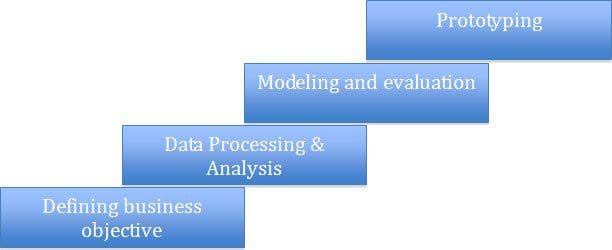
A typical data science assignment can have the following stages:
Let me explain using a simple case study:
There is an online retailer, who is running a shopping festival in the month of November, just before the holiday season. It has a catalogue of a million products and a database of 100 million customers, who had bought from them in the past.
The retailer wants to do promotional email campaigns to its customer base. The objective is to run a series of “successful email campaigns”.
Lets now understand the different life stages of this particular assignment:
1. Defining business objective:
This is an extremely crucial stage given that a wrong interpretation of the business problem/objective at hand can lead to a faulty solution and undesirable results. The role of data-science, if you really think about it, is to use data and insights from it to solve real-world problems. From that perspective, accurately identifying the problem and defining the objective is crucial for a successful outcome. In this example, the marketer wants to send customized emails to each of its customer showing a list of product offers curated according to the customer’s preferences and tastes:

In this case, to define the business objective, we have to ask a couple of questions:
1. Do we send emails to the entire list of 100 MM customers or to a select group of customers?

Source: daric.classtell.com/
The retailer is organizing a shopping festival, so it might make sense to send emails to all 100 MM customers, but still certain points need to be considered:
a. By bombarding emails to all their customers, would it leave some customers unhappy. e.g. the ones who do not actively shop with the retailer.
b. Since we want to show curated list of products to the customers (based on the individual’s preferences), so, if all 100 MM customers are taken into account, we may end up with a set of customers who might not show very high preference for any of the products (could be because they don’t shop enough with the retailer, and therefore, the retailer doesn’t have enough information to know their preferences)
c. Sometimes, data processing and storage costs could also be a consideration. Processing 100 MM customers and their characteristics, running machine-learning algorithms can be quite time and resource intensive. While infrastructure could be available to handle that, but along with the first two considerations, it may make sense to exclude some customers, especially to speed up time to market.

Source: mobileadvertisingwatch.com
2. How do we define and quantify the success metric? This is an extremely important decision and is directly linked to the business goals. In the above case, we can have a few possible success metrics:
a. Purchase Rate of the campaign (#of purchases/#of emails sent): This metric will give how effective the campaign had been to persuade customers to spend. So, if the retailer is just concerned with how much sales the entire campaign drove, then this is the metric to go for!

Source: https://www.jaroop.com/web-traffic/
b. Email Open rate of the campaign (#of emails opened/#of emails sent): This could be important if the retailer wants to understand other factors like how effective the email campaign content has been, specifically, in this case, how “catchy” the email subject has been. Similarly, email click through rates (after one has opened the email, clicks on the web links provided in the email, to land on the retailer’s website) shows how effective email content has been.
c. Profitability of the campaign: Sometimes, instead of just getting more number of customers to respond (i.e. driving higher response rate), the retailer could be interested in driving higher spend per customer. Think of it this way – a campaign focused on driving more and more customers to spend could end up attracting customers who may buy a lot of products but of lower value, eluding customers who may buy less but buy high value products.
2. Data processing and analysis:
This, again is another very important stage wherein we understand in detail the data available to us and how we can use it to accurately solve the problem at hand.
Broadly, there can be the following steps in this stage:
- Missing value treatment
- Outlier treatment
- Data Segmentation
- Feature engineering
Let us go through them one – by – one to get some intuition on why the step is required. In the above case example, lets say you have data like below, from past promotional email campaigns:
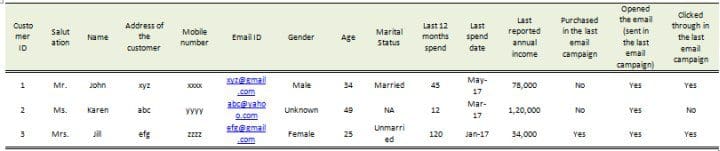
This data above is a snapshot of three customers (out of 100MM customers that the online retailer has) and some of their information.
One can see that the Gender of the 2nd customer is not known. Gender can be powerful information, hence, if a large percentage of the customers are of “unknown” or “missing” gender, then we will lose a very important piece of information. There can be many ways to impute Gender (through the salutation or the name) and hence can be used for missing value treatment. Similarly, if reported annual income is missing (since this information is provided by the customer only and he/she may not be willing to provide that), we can use last 12 months spend to impute/predict the annual income.
Outlier treatment is also important. For example, we could see some very high values of “last 12 month spend” or “annual income”. In case of spend, it could be because of some one-off high dollar spending by certain customers which may not persist and which can bias the entire data, hence capping the spend values at some threshold (e.g. 99 or 95 percentile value of “last 12 month spend”) can help reduce such bias.
Sometimes, we may see that there are distinct segments of customers within the data that behave very differently. For example, if we look at recent customers (became members of the online retailer in the last 6 months), these customers are likely to behave in a very different manner than the rest of the customers (they may be very inquisitive, so email open rates could be very high, but purchase rates could be low). Hence mixing these customers with the rest of the customers can either bias the data on certain parameters or these customer’s features may get overshadowed by rest of the customers, reducing their representation on any prediction algorithm that is built. In such cases, it may make sense to build separate algorithms for these two “data segments” (new customers and remaining customers)

Feature engineering: Features or variables are really what gives predictive power to the algorithms. So, having the right set of features is key to building a robust algorithm – hence the focus on feature engineering. Types of feature engineering:
- Feature selection: Selecting a subset of features that are most useful to the problem. There are many feature selection algorithms like scoring algorithms based on concepts of correlation, information value or other feature importance. With more and more computing power and machine learning techniques, however, feature selection is increasingly being handled within the algorithm.
- Feature Construction: The manual construction of new features from raw data e.g. in the above case study, we have a feature “last spend date”, which in itself might not provide any predictive power. However, we can create a feature “days since last spend”, which can be very powerful (a customer who has recently spent, could have higher intent to spend again and therefore could be more responsive to an email offer)
- Feature Extraction: Some data like image, voice, text can have multiple features, so, through feature extraction, we can automatically reduce the dimensionality of these types of features and also extract hidden features from the data. For e.g. in image recognition like the Pokemon image below, each image can have hundreds of features (pixels). So, any image recognition algorithm has to deal with a huge number of features from multiple images. Hence, the algorithm has to be able to automatically extract and reduce these large numbers of features to a smaller set of meaningful features.