Best Practices in Data Visualization
Do your data visualizations need a reboot? Though data visualizations may be designed to facilitate understanding, not all graphs are effective. In this webcast, viewers will learn how to use best practices to give a graph a makeover.
 As anyone working with analytics can attest, graphs help us to better understand what we see in our data sets. Though data visualizations may be designed to facilitate understanding, not all graphs are effective.
Do your data visualizations need a reboot?
JMP allows you to construct and revamp visuals with ease, expanding their potential as analytical tools.
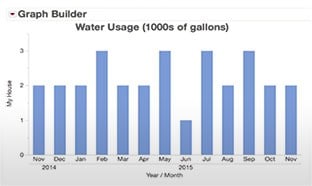
In this webcast, viewers will learn how to use best practices to give a graph a makeover. With the JMP Graph Builder, we see that an effective graph can transform even the simplest data set into a compelling case study.
Viewers will develop a better understanding of:
- Why data visualization is important.
- How to get the most out of graphs.
- JMP data visualization basics.
Register here.