Crop Disease Detection Using Machine Learning and Computer Vision
Computer vision has tremendous promise for improving crop monitoring at scale. We present our learnings from building such models for detecting stem and wheat rust in crops.
By Srinivas Chilukuri, ZS New York AI Center of Excellence
International Conference on Learning Representations (ICLR) and Consultative Group on International Agricultural Research (CGIAR) jointly conducted a challenge where over 800 data scientists globally competed to detect diseases in crops based on close shot pictures. The objective of this challenge is to build a machine learning algorithm to correctly classify if a plant is healthy, has stem rust, or has leaf rust.
Wheat rust is a devastating plant disease affecting many crops, reducing yields and affecting the livelihoods of farmers and decreasing food security across Africa. The disease is difficult to monitor at a large scale, making it difficult to control and eradicate. An accurate image recognition model that can detect wheat rust from any image will enable a crowd-sourced approach to monitor crops.
Data
The imagery data came from a variety of sources. The bulk of the data was collected in-field by International Maize and Wheat Improvement Center (CIMMYT) and their partners in Ethiopia and Tanzania. The remainder of the data were sourced from public images found on Google Images. For this challenge, external data, other than the data provided, was prohibited. Below are a few examples of data by category viz., healthy wheat, leaf rust and stem rust.
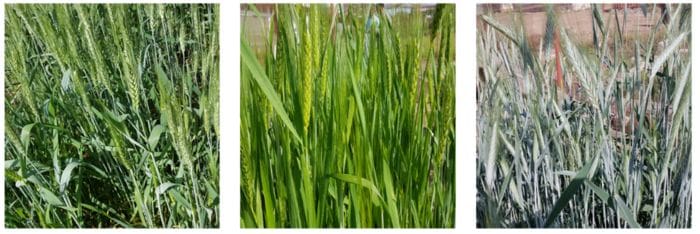
Leaf rust
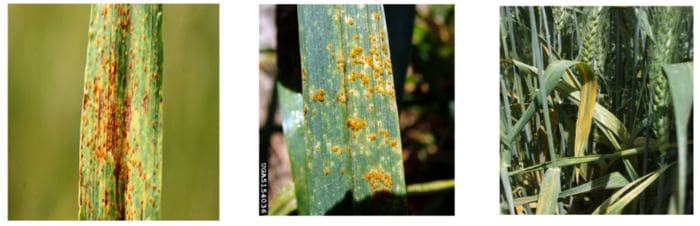
Stem rust
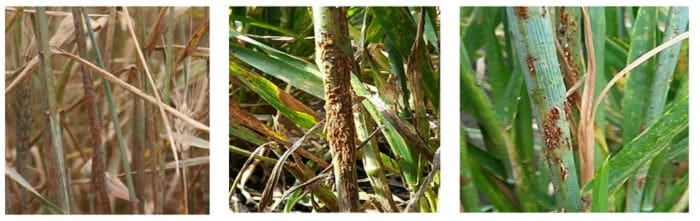
Figure 1. Sample images of different categories
There were 876 images in the data that were provided to train the AI model (142 healthy, 358 leaf rust and 376 stem rust). The test data on which the final performance would be measured, had 610 images and their labels were not revealed to the participants
Methodology
The state of the art approach for determining a plant’s health based on pictures is a type of deep learning called Convolutional Neural Network (CNN). The overall modeling process required several steps for effectively preparing the data for the CNN model to yield a good result. Figure 2 below illustrates the detailed set of steps involved.
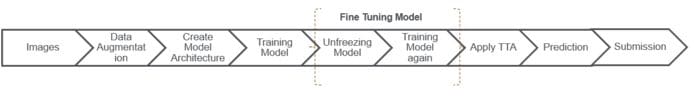
Of the various steps in the pipeline, Data Augmentation particularly played a significant role in increasing the model performance. We used multiple data augmentation techniques -illustrated below.
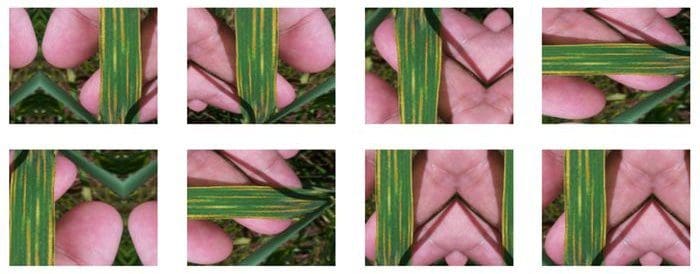
a. Vertical and Horizontal Flip
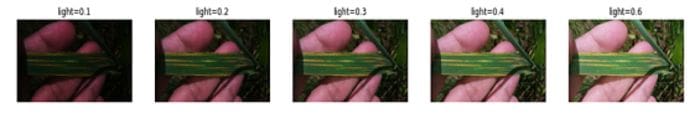
b. Lighting standardization
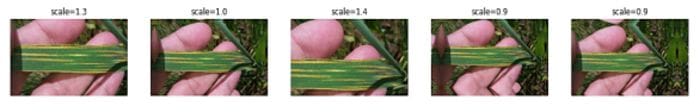
c. Zoom and Crop
The next critical step is the CNN model architecture design. We used transfer learning to build on the existing ImageNet models. While there are multiple pre-trained models available (viz., VGG, ResNet, InceptionV3, DenseNet, EfficientNet, etc.) we chose DenseNet201 for its lower complexity, fewer parameters and cost-effective computation.

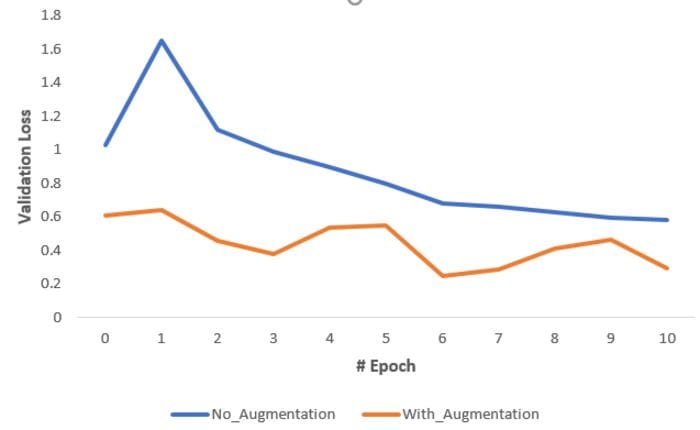
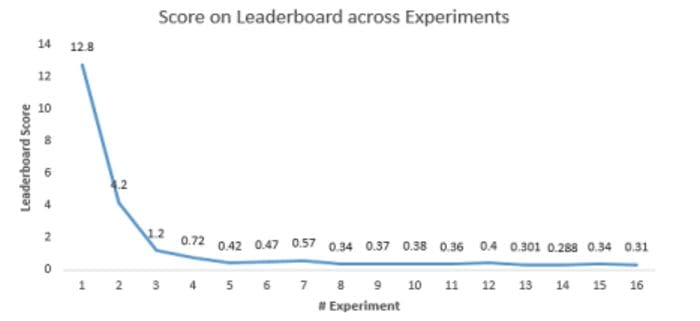
We tuned the model, along with different data augmentation methods iteratively before we achieved our final performance. For reference, we show how the model performance has evolved over the iterations in Figure 5.
Results
Our final score was a log loss of 0.288 on the test dataset ranking 53rd on the final leaderboard among 839 participants. Over the test sample of 610 images, this translated to approximately 580 correctly classified instances – in other words, the model accuracy is 95%. This is quite good for practical usage and considering that we trained only on the limited competition dataset, the accuracy can be further improved by adding more data points.
Performance is great but, [what] has the model learnt?
a. Model explanations
Outside of competition setting, if we expect our model to be used in practical applications, it is important to explain why the model classified a given image. We explored a few examples using an explainable AI technique called Gradient-weighted Class Activation Map (Grad-CAM) to highlight the areas of images that the model based its decision on. Figure 6 illustrates a couple examples.
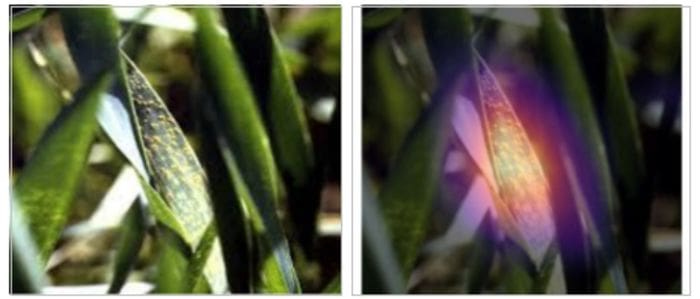
Stem Rust: Original Image (Left) and Grad-CAM Heatmap Image (Right)
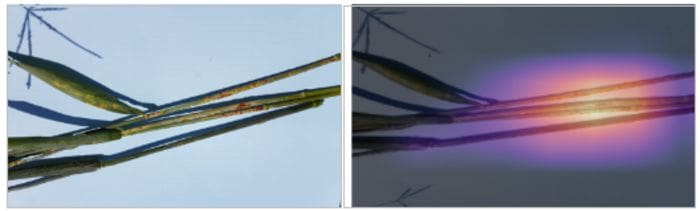
Figure 6. Explaining model predictions using Grad-CAM
From the explanation, we can see that the model managed to latch on to the rust portions of leaf and stem to accurately classify the category.
b. Inferring how the models see the different classes using Deep Dream
One way to visualize what the model has learnt is to turn the network upside down and ask it to enhance an input image in such a way as to elicit an output class. Say you want to know what sort of image would result in “Banana”, start with an image full of random noise, then gradually tweak the image towards what the neural net considers a banana. This is called Deep Dream
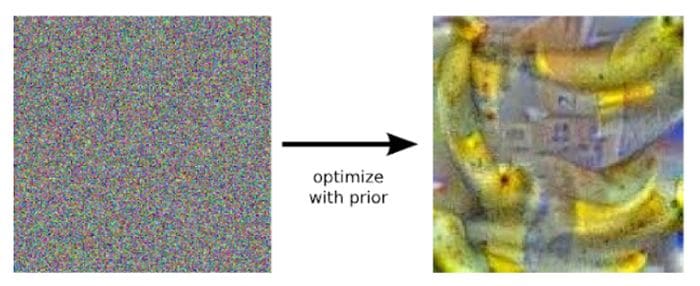
We applied the deep dream approach on our model and generated the figures for the respective classes. The below figures each specify what the model thinks in general an image looks like for a respective class.
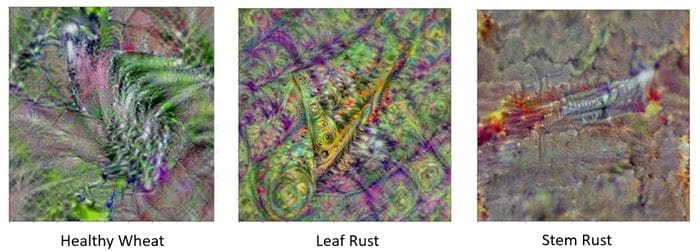
We notice for different classes, our model has found important distinguishing patterns:
- Healthy Wheat: Major color is green, has leaf-like features, no rust-related colors such as yellow/orange
- Leaf Rust: Has mixture of colors, has leaf-like pattern and there are rust-related colors (yellow/orange) on leaf-like pattern
- Stem Rust: Has tube-like pattern and there are rust-related colors (yellow/orange) on tube-like pattern
Conclusion
In this article, we have shown how deep learning techniques can be applied to detect wheat rust in crops based on close shot images. In addition to good prediction accuracy, we have also demonstrated that the model is able to effectively learn the right representations through the explanations inferred from class activation maps. When scaled, this approach can help in digitally monitoring crop health and could lead to significant improvement in the agriculture productivity and yield.
The ZS AI team ranked in the top 6% on the final leaderboard with a prediction accuracy of 95%.
Bio: Srinivas Chilukuri leads the ZS New York AI Center of Excellence. He has 15+ years of experience in helping clients across industries in designing and implementing AI solutions.
Related:
- Satellite Image Analysis with fast.ai for Disaster Recovery
- Using AI to Identify Wildlife in Camera Trap Images from the Serengeti
- Machine Learning in Agriculture: Applications and Techniques