Monitoring Apache Spark – We’re building a better Spark UI
Data Mechanics is developing a free monitoring UI tool for Apache Spark to replace the Spark UI with a better UX, new metrics, and automated performance recommendations. Preview these high-level feedback features, and consider trying it out to support its first release.
By Jean-Yves Stephan, Data Mechanics.

The Spark UI is the open source monitoring tool shipped with Apache Spark, the #1 big data engine. It generates a lot of frustration among Apache Spark users, beginners and experts alike.
- “It’s hard to understand what’s going on.”
- “Even if there’s a critical information, it’s buried behind a lot of noisy information that only experts know how to navigate.”
- “There’s a lot of tribal knowledge involved.”
- “The Spark history server is a pain to setup.”
Data Mechanics is a YCombinator startup building a serverless platform for Apache Spark — a Databricks, AWS EMR, Google Dataproc, or Azure HDinsight alternative — that makes Apache Spark more easy-to-use and performant.
In this article, we present our ambition to replace the Spark UI and Spark History Server with a free and cross-platform monitoring tool for Spark called the Data Mechanics UI. The project is at the prototype phase, but we'd love your feedback before we push it to production.
What’s wrong with the Spark UI?

The familiar Spark UI (jobs page).
It’s hard to get the bird’s eye view of what is going on.
- Which jobs/stages took most of the time?
- How do they match with my code?
- Is there a critical stability or performance issue?
- What is the bottleneck of my app (I/O bound, CPU bound, memory bound)?
The Spark UI lacks essential node metrics (CPU, Memory, and I/O usage).
- Without them, any significant infrastructure change is a dangerous leap of faith.
- To enable them, you need to set up a separate metrics monitoring system (such as Ganglia, or Prometheus + Grafana), and then constantly jump back and further between this system and the Spark UI, trying to match the timestamps.
The Spark History Server (rendering the Spark UI for terminated Spark apps) is hard to setup.
- You need to persist Spark event logs to long-term storage and often deploy it yourself.
- It can take forever to load, and it often crashes.
What does the Data Mechanics UI look like?

This GIF shows our prototype Data Mechanics UI in action!
What is new about it? Let's go over the main sections.
Summary statistics

TheData Mechanics UI - Summary Statistics.
The section shows the duration of the app, the total amount of resources (CPU uptime), the total duration of all the Spark tasks (should be close to your CPU uptime if your app is well parallelised). This information - surprisingly hard to get! - is critical if you care about your infrastructure costs.
Recommendations
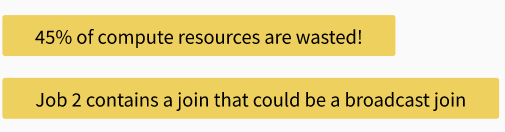
The Data Mechanics UI – Recommendations.
This section builds upon the Data Mechanics platform auto-tuning feature where infrastructure parameters and Spark configurations are continuously optimized to boost performance and stability based on the history of the past runs of a given application.
This section gives high-level actionable feedback to developers, such as:
- “Job 4 suffers from an input data skew. Consider repartitioning your data or salting the partition key”.
- “The default number of tasks (200) is too small compared to the number of CPU cores (400) available. Increase spark.sql.shuffle.partitions to 1200.”
Executors CPU Usage
The Data Mechanics UI - Executors CPU Usage.
This screen lets you visually align system metrics on CPU utilization with the different Spark phases of your app. In a couple of seconds, you should see if your app is spent on an expensive shuffle operation, if a lot of resources are wasted due to inefficient parallelism, or if it is bottlenecked by I/O operations or CPU-intensive operations.
So this information is critical to understand your application performance and make smarter choices. You can then click on a specific job or stage to dive deeper into the problematic phase.
Executors Peak Memory Usage

The Data Mechanics UI - Executors Peak Memory Usage.
This screen shows you the memory usage breakdown for each executor when the total memory consumption was at its peak. Again, you'll immediately see if you're flirting with your container memory limits (maybe hitting OutOfMemory issues) or, on the contrary, if your memory is largely overprovisioned.
Memory issues are the most common sources of crashes for Apache Spark. OutOfMemory comes in two flavors:
- The JVM can run out of memory. The JVM heap grew to its maximum size, and despite a full GC, it couldn't allocate more space. This can happen due to skewed shuffles, high concurrency, improper use of caching, or simply too small heap size settings.
- The cluster manager (like YARN or, our favorite, Kubernetes) can kill a container because it exceeded its memory limit. This happens a lot when using PySpark, as a Spark executor will spawn one python process per running task, and these processes memory usage can quickly add up. This is very hard to troubleshoot for PySpark users, as almost no monitoring tool reports the memory usage of python processes, even though PySpark makes up the larger portion of the Spark community.
So this screen should give you critical information to make and keep your Spark applications stable.
How does the Data Mechanics UI work? How can I use it?
Due to technical reasons, the Data Mechanics UI will not be implemented in Spark open-source. But it will work on top of any Spark platform, entirely free of charge.
To use it, you’ll need to install an agent - a single jar attached to Spark. The code for the agent will be open-sourced, and we'll provide init scripts to install it automatically for each major Spark platform. Once this is done, you're done! The agent will send the Spark event logs to the Data Mechanics backend infrastructure, which will serve the Data Mechanics UI in your web browser!
Initially, it will only be available for terminated apps (a few minutes after they've run), so it will be more of Spark History Server than a live Spark UI replacement. We hope it'll be useful to you nonetheless!
Conclusion: We need YOU to make this happen
Data Mechanics is a managed platform for Apache Spark - like Amazon EMR, Google Dataproc, Databricks, and others. Our serverless features make Spark more easy-to-use and performant. It is deployed inside our customer's cloud account on a Kubernetes cluster that we manage for them, and it is available on AWS, GCP, and Azure.
The Data Mechanics UI will be a great complement to this platform — it would give Spark developers the high-level feedback about their code that they need to develop, scale, and maintain stable and performant Spark applications.
UPDATE November 2020. A first milestone of Data Mechanics Delight has been released. For now it only consists of a free hosted Spark History Server, but the team is planning a next release with new screens and metrics by January. Check out our website to sign up.
Bio: Jean-Yves Stephan, a former software engineer and Spark infrastructure lead at Databricks, is now the Co-Founder and CEO at Data Mechanics, a serverless platform making Apache Spark easy to use and performant.
Related: